- The US NFP, Average Hourly Earnings, and Unemployment Rate should bring sharp movements.
- A bearish pattern below the resistance levels may announce a new leg down.
- A new higher high activates further growth.
The GBP/USD price edged higher on Thursday. The pair is trading at 1.2528 while writing. The greenback was overbought. That’s why it has depreciated even though the US reported some positive data yesterday.
–Are you interested to learn more about ETF brokers? Check our detailed guide-
The ADP Non-Farm Employment Change was reported higher at 278K versus 173K expected, while Unemployment Claims came in at 232K in the last week compared to 236K forecasts.
In addition, Construction Spending rose by 1.2%, beating the 0.2% forecasts. Unfortunately for the greenback, the ISM Manufacturing Prices, Final manufacturing PMI, Wards Total Vehicle Sales, Revised Nonfarm Productivity, and Revised Unit Labor Costs came in worse than expected.
The Non-Farm Employment Change is expected at 193K in May versus 235K in April. The unemployment rate could jump from 3.4% to 3.5%, while Average Hourly Earnings may report a 0.3% growth.
These represent high-impact events and could really shake the price. I’m expecting to see sharp movements in both directions in the GBP/USD pair later today. Positive data could boost the USD, dragging the currency pair down.
GBP/USD price technical analysis: Supply zone
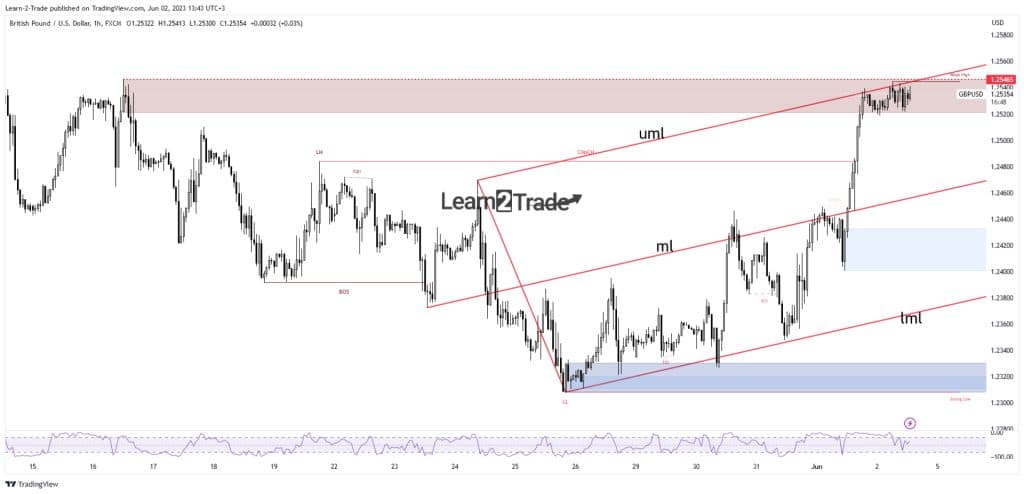
From the technical point of view, the GBP/USD pair extended its upwards movement after taking out the median line (ml). The valid breakout through this dynamic resistance resulted in a potential growth towards the next upside target represented by the upper median line (uml).
–Are you interested to learn more about Thailand forex brokers? Check our detailed guide-
As you can see on the hourly chart, the price found resistance after reaching this dynamic resistance. It has registered only false breakouts above this obstacle.
The 1.2546 level represents a static resistance. It’s located in a major supply zone, so a bearish pattern may announce a new leg down.
On the other hand, a new higher high, a valid breakout above the upper median line (uml), and through 1.2546 activates further growth.
Looking to trade forex now? Invest at eToro!
68% of retail investor accounts lose money when trading CFDs with this provider. You should consider whether you can afford to take the high risk of losing your money.
