GBP/USD has been consolidating its losses above 1.2500 and still looking for a new direction. What do the technical levels reveal?
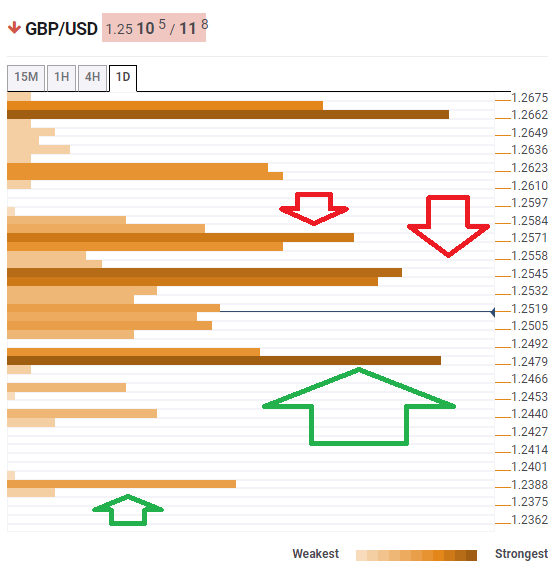
The Technical Confluences Indicator shows that GBP/USD enjoys significant support at 1.2479 where we note the convergence of the previous yearly low, the Pivot Point one-day Support 2, and the previous weekly low.
However, if cable falls below this level, the next cushion is weak and only at 1.2388 where the Pivot Point one-month Support 2.
Resistance awaits at 1.2545 where a dense cluster of lines awaits pound/dollar. It includes the PP 1d-R1, the PP 1m-S1, the previous daily high, the Fibonacci 23.6% one-week, and the Bollinger Band 1h-Upper.
Further up, another noteworthy cap awaits at 1.2571 which is the meeting point of the Fibonacci 161.8% one-day and the Fibonacci 38.2% one-week.
This is how it looks on the tool:
Confluence Detector
The Confluence Detector finds exciting opportunities using Technical Confluences. The TC is a tool to locate and point out those price levels where there is a congestion of indicators, moving averages, Fibonacci levels, Pivot Points, etc. Knowing where these congestion points are located is very useful for the trader, and can be used as a basis for different strategies.
This tool assigns a certain amount of “weight” to each indicator, and this “weight” can influence adjacents price levels. This means that one price level without any indicator or moving average but under the influence of two “strongly weighted” levels accumulate more resistance than their neighbors. In these cases, the tool signals resistance in apparently empty areas.
