- The United States had a small increase in new unemployment benefit claims.
- In November, US producer prices rose a little more than expected.
- Markets are awaiting the BoE and Fed meetings.
The GBP/USD weekly forecast is flat as investors will likely sit on their hands until inflation data comes out ahead of the central bank meetings.
-Are you looking for automated trading? Check our detailed guide-
Ups and downs of GBP/USD
This past week, investors were interested in US data, such as the producer price index and initial unemployment claims. There was also PMI data from the UK showing a contraction.
The United States had a small increase in the number of new unemployment benefit claims, which shows that the labor market is still strong and tight.
In November, US producer prices rose a little more than expected. The annual inflation at the factory gate registered its smallest gain in 1-1/2 years, signaling a slowdown in the trend.
Next week’s key events for GBP/USD
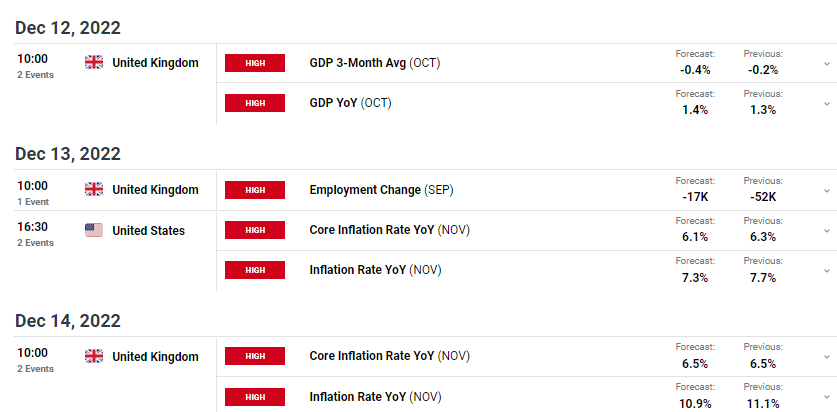
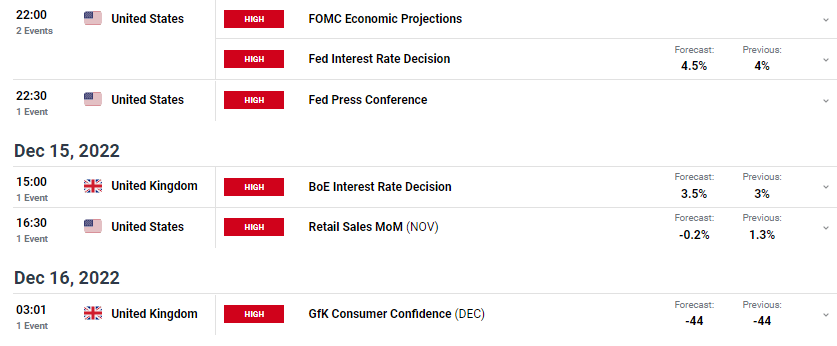
There will be many important news releases from the US and the UK next week. However, the inflation data and central bank meetings will interest investors more.
The inflation data from the US and Uk will be released ahead of the central bank meetings. These will make the GBP/USD exchange rate very volatile.
Next week, the BoE and the Fed will meet and hike interest rates to control inflation. There will be a lot of volatility if there are surprises. Investors anticipate increases from both central banks of 50 basis points.
GBP/USD weekly technical forecast: Bulls need a stronger candle to break above 1.2300
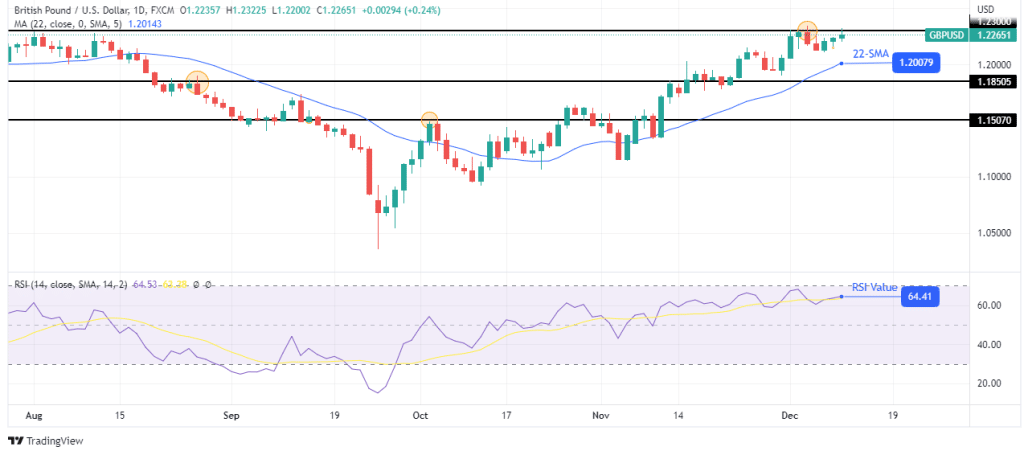
Looking at the daily chart, it is clear that the price is in a bullish trend as it is trading above the 22-SMA, and the RSI is above 50. Bulls have consistently broken above resistance levels and are trading at the 1.2300 key resistance level.
-If you are interested in forex day trading then have a read of our guide to getting started-
Bulls have attempted to break above this key level but have failed. The second attempt is, however, looking weaker than the first. This could mean another failure. Bulls must gather more momentum to break above the 1.2300 key resistance level. If they don’t, bears might reverse the trend.
Another sign of weakness is the fact that the price is trading close to the 22-SMA. Bears must break below the 22-SMA to reach the 1.1850 and 1.1507 support levels.
Looking to trade forex now? Invest at eToro!
67% of retail investor accounts lose money when trading CFDs with this provider. You should consider whether you can afford to take the high risk of losing your money.
