The British pound was somewhat cheered by the extension of Mark Carney’s tenure at the Bank of England. Nevertheless, it was one of the worst performing currencies in October and the wider picture for 2016 looks even worse. The team at Citi compares the current situation to 1992 and sees much deeper lows for cable.
Here is their view, courtesy of eFXnews:
Firstly this should be called “Brexit II”.
Brexit I was Britain exiting the Exchange Rate Mechanism of Europe in September 1992. That month GBPUSD traded a high of 2.01, collapsed as the GBPDEM rate could no longer be defended, posted a bearish outside month, bounced, and then fell again. The low of the trend was 1.41 six months later in March 1993. That was a high to low move of 30%.
For lots more FX trades from major banks, sign up to eFXplus
By signing up to eFXplus via the link above, you are directly supporting Forex Crunch.
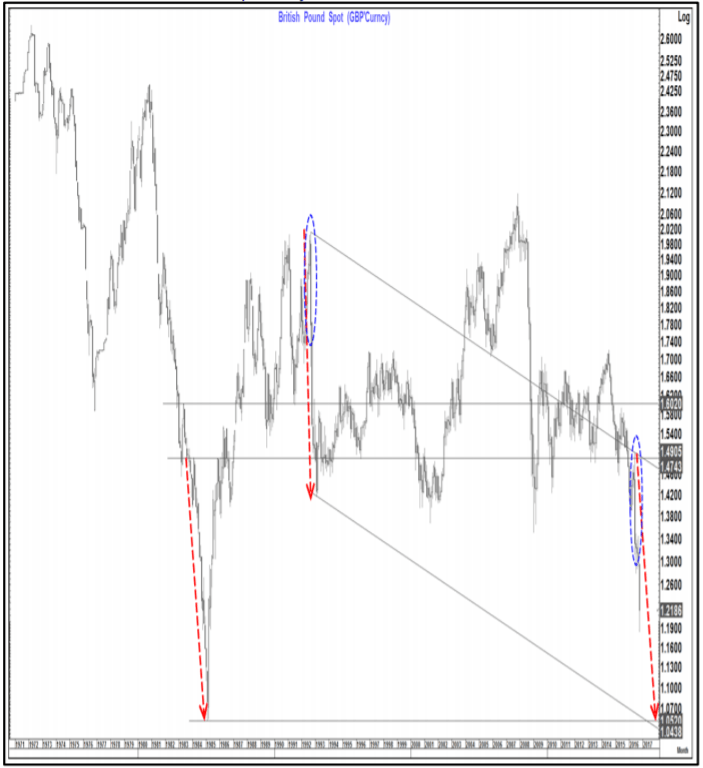
A move similar in magnitude and timeframe to that seen in 1992-1993 (ERM exit) would suggest 1.05 by December 2016 while the 1984-1985 timeframe suggests a similar level by June 2017.
