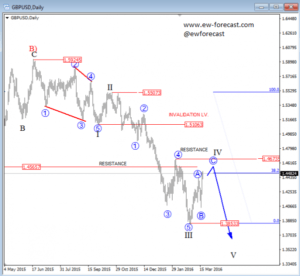
GBPUSD has turned up in the last few weeks with a very sharp price action as seen in wave IV within a big impulsive downtrend. Fourth waves usually retrace back to the area of a former wave four, and also for around 38.2% compared to wave three. Well, we can see this around that area, plus there is also a swing low of 1.4565 since 2015 that can also turn into a resistance. So if we put all into one context then 1.4600 can be a very interesting new reversal zone, so be aware of a resumption of a bearish trend in days ahead.
GBPUSD, Daily
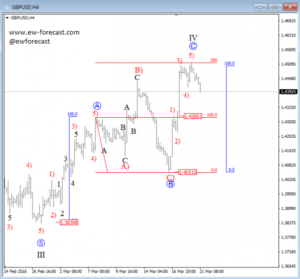
On the lower time frame, we see that GBPUSD recovered sharply last week after a nice turn up from 1.4050 level where we called end of an expanded flat correction. It was a perfect textbook pattern within the ongoing recovery in wave IV. Well notice that the pair is turning down now after it touched some important Fibonacci resistance levels for wave C-circled. In fact, the pair is already beneath the swing low of a red wave 4) that is the first indication of a top in place. However, we would still love to see 1.4288 broken for even stronger conviction regarding the bearish case.
GBPUSD, 4H