GBPUSD intra-day analysis
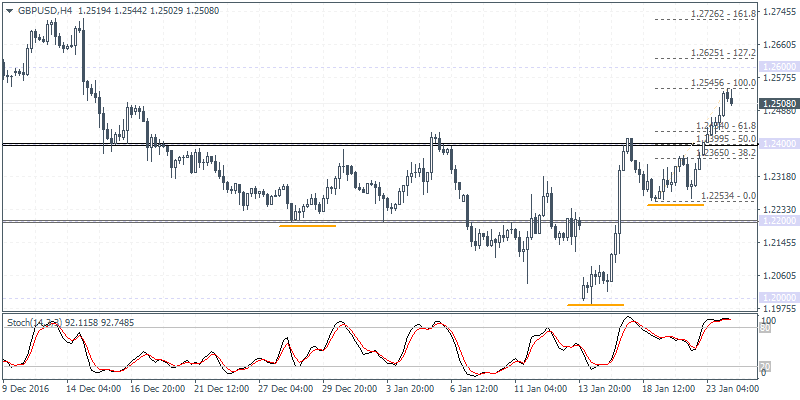
GBPUSD (1.2508): GBPUSD posted a strong reversal yesterday with price breaking out above 1.2400. We suspect the GBPUSD’s inverse head and shoulders pattern is now in play. In the near term, expect a pullback towards 1.2400 although it is unlikely that GBPUSD will correct this far. Look for a reversal between 1.2434 – 1.2365 which marks the 38.2% – 61.8% Fibonacci retracement level of the rally from 1.2253 – 1.2545. To the upside, GBPUSD will be looking to target 1.2800 which is the minimum upside target of the inverse head and shoulders pattern.
EURUSD intra-day analysis
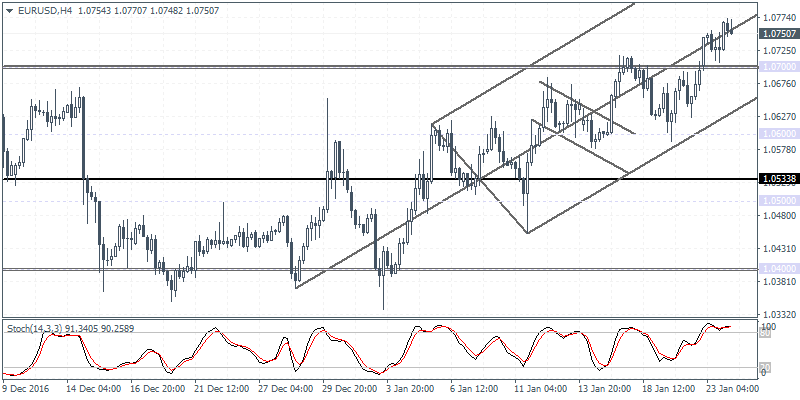
EURUSD (1.0750): EURUSD could be in for a short term correction to the downside after price rallied towards 1.0765 – 1.0800 resistance level yesterday. The breakout from 1.0500 off the falling median line saw a straight rally with little to no pullbacks. Furthermore, there is a chance that the current pullback from 1.0765 – 1.0800 will result in a right shoulder formation of the inverse head and shoulders pattern near 1.0600 – 1.0551. This could potentially pave the way for a medium-term rally towards 1.1100. On the 4-hour chart, EURUSD is seen trading near the rising median line with the potential for the declines to extend on a break down below the support level at 1.0700. Watch for a retracement back to 1.0700 for a confirmed move to the downside towards 1.0600.
XAUUSD intra-day analysis
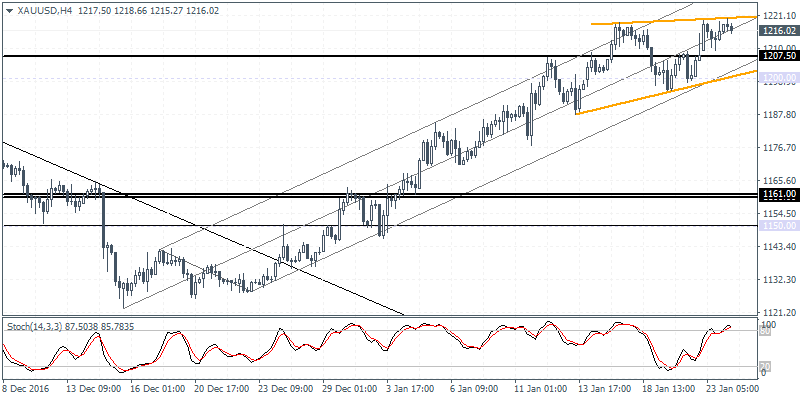
XAUUSD (1216.02): Gold prices continue to maintain their gains after price tested the $1200 support level a few days ago resulting in a doji pattern and a bullish follow through. Further upside gains could see gold prices rise towards the resistance level of 1240 – 1250, but the risks of a downside correction remains. On the 4-hour chart, gold prices are seen consolidating into a triangle pattern which will see a decline towards 1189 at the very least if price breaks down to the downside. The major technical support is seen at 1161.00, however, where a correction is likely to occur with the technical support pending a retest.
