GBP/USD reversed directions last week, posting modest gains. The pair closed the week at 1.5581. This week’s highlight is Retail Sales. Here is an outlook on the major events moving the pound and an updated technical analysis for GBP/USD.
In the US, retail sales was dismal and consumer sentiment fell short of expectations. Over in the UK, inflation numbers remain low while unemployment claims was much higher than expected, hurting the pound.
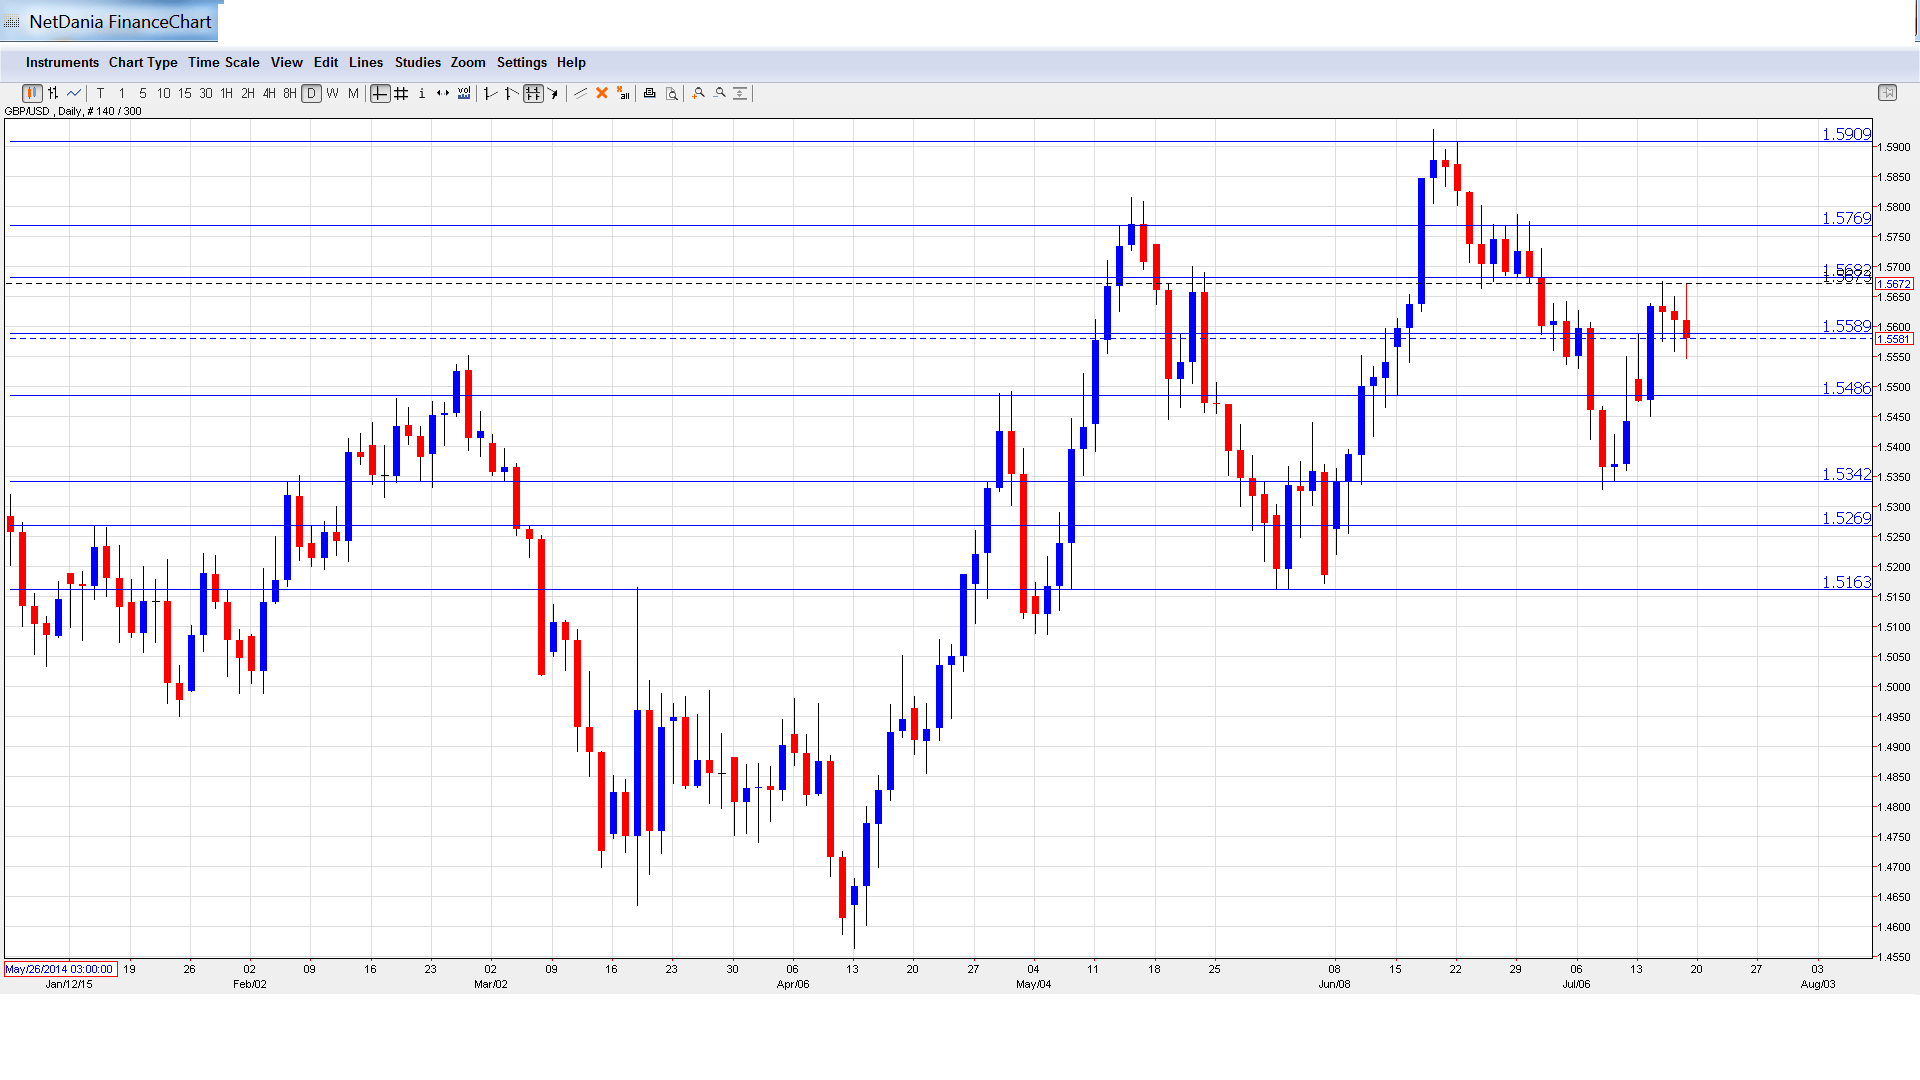
[do action=”autoupdate” tag=”GBPUSDUpdate”/]GBP/USD graph with support and resistance lines on it. Click to enlarge:
- Rightmove HPI: Sunday, 23:01. This housing inflation indicator provides a snapshot of the level of activity in the UK housing sector. The index jumped 3% in the June reading. Will the indicator repeat with another strong gain in the July release?
- Public Sector Net Borrowing: Tuesday, 8:30. The May deficit ballooned to GBP 9.4 billion pounds, This was up from GBP 6.0 billion a month earlier, but was better than expected. The markets are expecting the deficit to narrow to GBP 8.6 billion pounds in the July report.
- MPC Official Bank Rate Votes: Wednesday, 8:30. The BOE held rates at 0.50% at its most recent policy meeting, and the MPC vote is expected to be unanimous (9-0).
- MPC Asset Purchase Facility Votes: Wednesday, 8:30. The MPC vote for QE is also expected to be a 9-0 vote. The BOE held QE at 375 billion pounds at the last policy meeting.
- Retail Sales: Thursday, 8:30. Retail Sales is a key event which should be treated by traders as a market-mover. The indicator softened in May to 0.2%, which was within expectations. The estimate for the June report stands at 0.4%.
* All times are GMT
GBP/USD Technical Analysis
GBP/USD opened the week at 1.5512, and dipped to a low of 1.5450, as the pair tested support at 1.5485 (discussed last week). The pair then reversed directions, climbing to a high of 1.5675. GBP/USD then retracted, closing the week at 1.5581.
Live chart of GBP/USD: [do action=”tradingviews” pair=”GBPUSD” interval=”60″/]
Technical lines from top to bottom
We begin with resistance at 1.6006, just above the symbolic 1.60 level.
1.5909 has held firm as resistance since November 2013.
1.5769 is the next resistance line.
1.5682 was an important cap in December 2014 and January 2015.
1.5590 saw action last week and is currently a weak resistance line.
1.5485 was tested and is an immediate support level.
1.5341 is the next support line. It has held firm since mid-June.
1.5269 was an important support level in March.
1.5163 is the final line of support for now.
I am neutral on GBP/USD.
Recent US numbers have been lukewarm, as underscored by last week’s retail sales and consumer confidence. However, Yellen’s relatively upbeat comments indicate that a rate hike is not far away. The Greek crisis appears to be over, at least for now, and this is bullish for the pound, with its close ties with the Eurozone.
In our latest podcast, we drill down the deals, the aGreekment and Iran and the market impact.
Further reading:
- For a broad view of all the week’s major events worldwide, read the USD outlook.
- For EUR/USD, check out the Euro to Dollar forecast.
- For the Japanese yen, read the USD/JPY forecast.
- For the kiwi, see the NZD/USD forecast.
- For the Australian dollar (Aussie), check out the AUD to USD forecast.
- For the Canadian dollar (loonie), check out the USD to CAD forecast.
