GBP/USD had an excellent week, gaining about 300 points. The pair closed just above the 1.25 level. There are 7 events on the schedule this week. Here is an outlook on the major market-movers and an updated technical analysis for GBP/USD.
[do action=”autoupdate” tag=”GBPUSDUpdate”/]
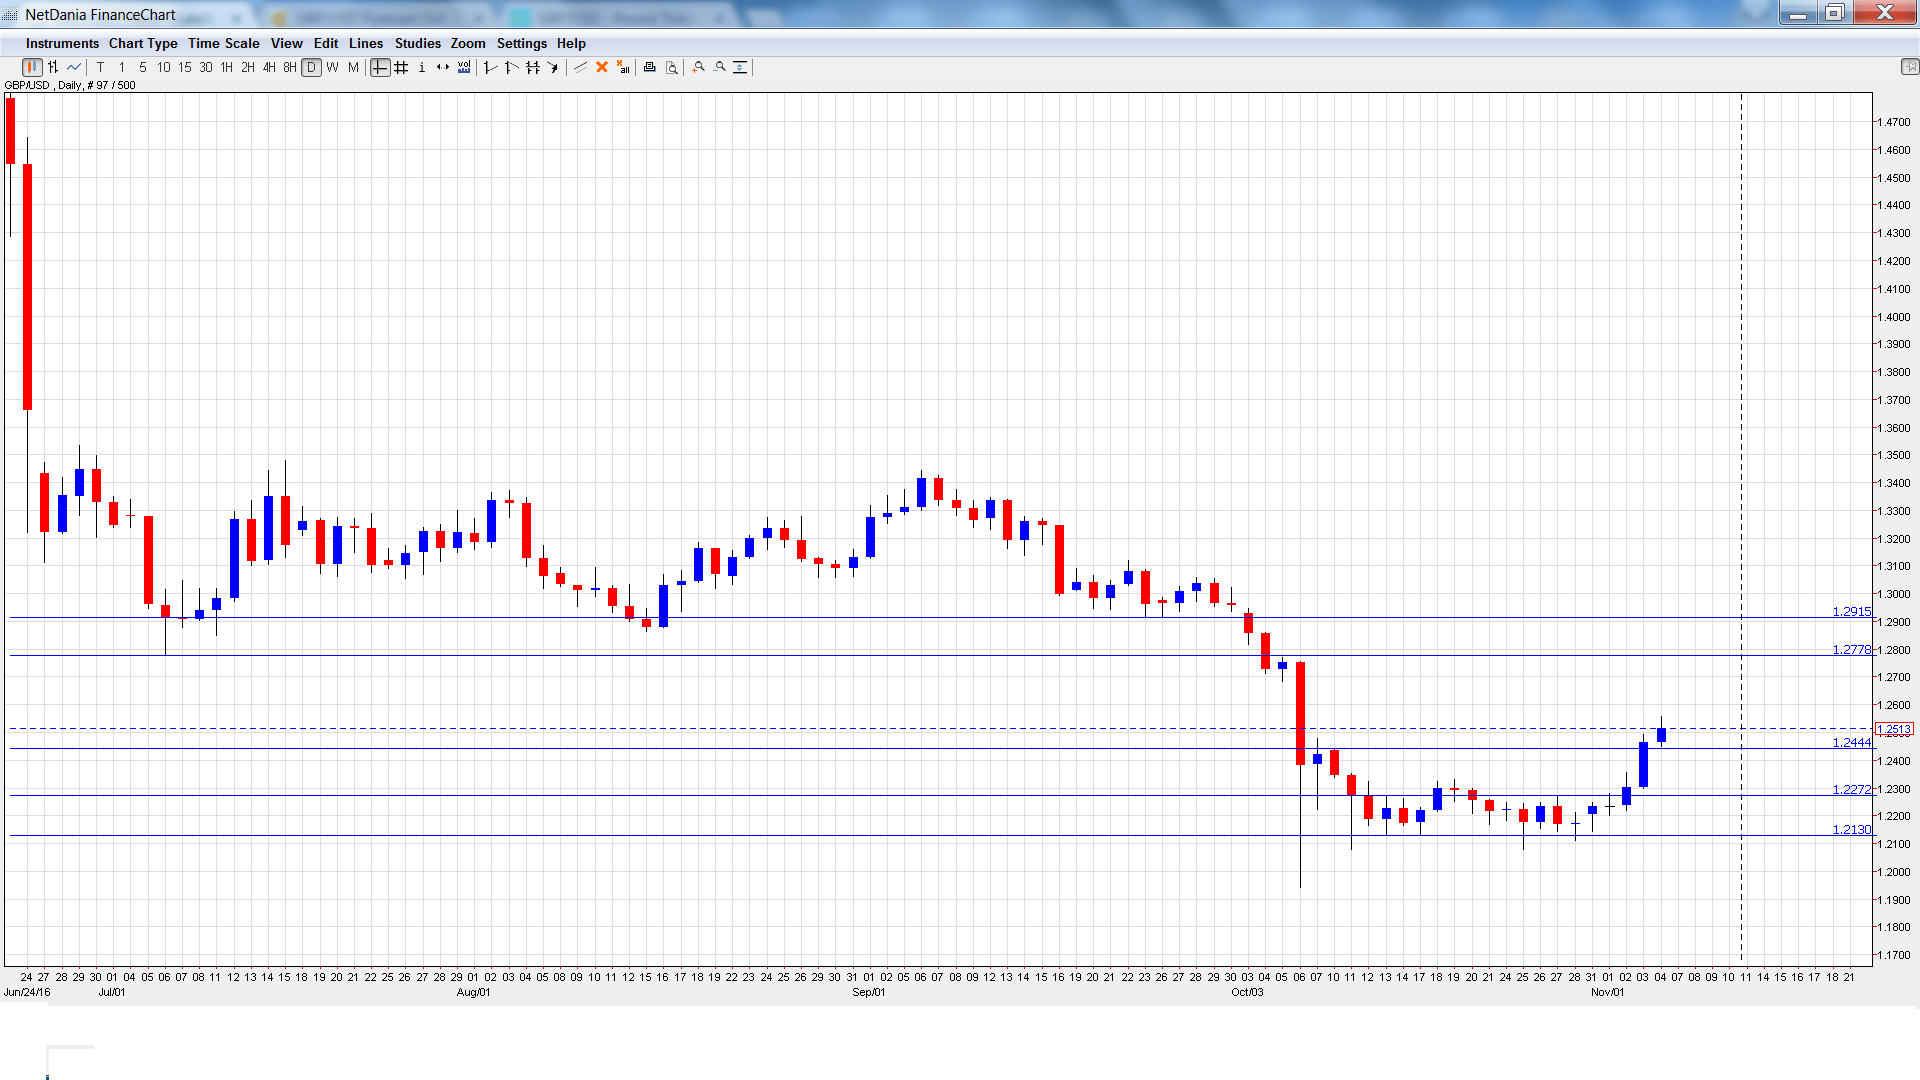
GBP/USD graph with support and resistance lines on it. Click to enlarge:
- Halifax HPI: Monday, 8:30. This housing inflation index provides a snapshot of the level or activity in the housing sector. The indicator posted a small gain of 0.1% in September, edging above the forecast of 0.0%. The markets are expecting a gain of 0.3% in October.
- BRC Retail Sales Monitor: Tuesday, 00:01. This indicator measures retail sales data in BRC shops. The index gained 0.4% in September, bouncing back from a 0.9% decline a month earlier.
- Manufacturing Production: Tuesday, 9:30. This is the key event of the week and should be treated as a market-mover. The indicator posted a gain of 0.2% in August, short of the forecast of 0.4%. The markets are expecting better news in September, with an estimate of 0.5%.
- NIESR GDP Estimate: Tuesday, 15:00. This monthly indicator helps analysts track the official GDP report, which is released every quarter. The indicator gained 0.4% in September, marking a 3-month high.
- Goods Trade Balance: Wednesday, 9:30. The UK deficit widened to GBP 12.1 billion in August, which was higher than expected. The deficit is expected to narrow to GBP 11.3 billion in September.
- RICS House Price Balance: Thursday, 00:01. The indicator continues to improve, pointing to a strengthening housing market. In September, the indicator rose to 17% and the upswing is expected to continue in October, with an estimate of 18%.
- Construction Output: Friday, 9:30. This construction indicator has failed to post a gain since April. This streak is expected to end in the September release, with an estimate of 0.2%.
* All times are GMT
GBP/USD Technical Analysis
GBP/USD opened the week at 1.2205 and quickly touched a low of 1.2143, as support held firm at 1.2130 (discussed last week). The pair then reversed directions and climbed sharply, touching a high of 1.2557 GBP/USD closed the week at 1.2513.
Live chart of GBP/USD:
Technical lines from top to bottom
With the pair posting sharp gains last week, we begin at higher levels:
1.2915 was a cushion in September but switched to a resistance line after sharp losses by GBP/USD.
1.2778 is next.
1.2620 was a cushion back in 1985.
1.2447 is next.
1.2272 marked the high point in October.
1.2130 is the final support level for now.
I am neutral on GBP/USD.
Our latest podcast is titled Bold in oil and talking up the currency
Follow us on Sticher or iTunes
Further reading:
- For a broad view of all the week’s major events worldwide, read the USD outlook.
- For EUR/USD, check out the Euro to Dollar forecast.
- For the Japanese yen, read the USD/JPY forecast.
- For the kiwi, see the NZD/USD forecast.
- For the Australian dollar (Aussie), check out the AUD to USD forecast.
- For the Canadian dollar (loonie), check out the USD to CAD forecast.
