GBP/USD posted gains for a second straight week, rising about 85 points. The pair closed the week at 1.5520. There are just four releases this week. Here is an outlook on the major events moving the pound and an updated technical analysis for GBP/USD.
In the US, the Federal Reserve kept the markets guessing till the very last minute, but in the end refrained from raising rates. US unemployment claims were better than expected, but the Philly Manufacturing Index posted a sharp decline, well below expectations. Over in the UK, there was positive news on the job front, as wages growth jumped and unemployment claims beat expectations.
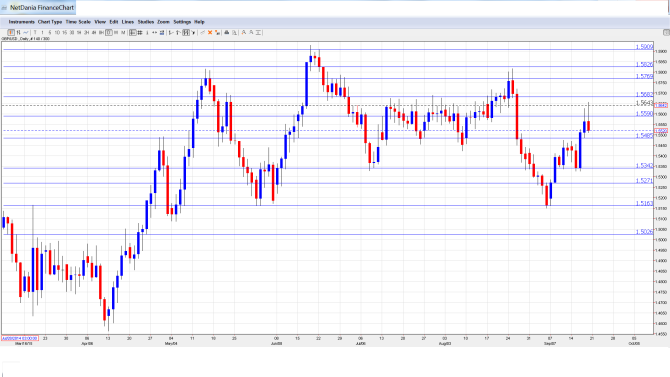
[do action=”autoupdate” tag=”GBPUSDUpdate”/]GBP/USD graph with support and resistance lines on it. Click to enlarge:
- Rightmove HPI: Sunday, 23:01. This housing price index provides a snapshot of the level of activity in the UK housing sector. The indicator has been slipping, and posted a decline of 0.8% in August, its first decline in 3 months. Will the downward trend continue in September?
- Public Sector Net Borrowing: Tuesday, 8:30. The indicator looked very sharp in July, with a reading of GBP -2.1 billion, within expectations. This marked the indicator’s first surplus in 6 months. However, the markets are expecting a large deficit in the August reading, with an estimate of GBP 8.7 billion.
- CBI Industrial Order Expectations: Tuesday, 10:00. The index is based on a survey of UK manufacturers. The indicator has been struggling, posting 4 straight declines. Still, the August reading of -1 point was much better than the forecast of -10 points. The estimate for the September report stands at 0 points.
- BBA Mortgage Approvals: Thursday, 8:30. This event is a leading indicator of housing market demand. The indicator has now improved over seven consecutive readings, and the July release of 46.0 thousand matched the forecast. The markets are expecting a slight improvement for August, with the estimate standing at 46.3 thousand.
* All times are GMT
GBP/USD Technical Analysis
GBP/USD opened the week at 1.5445 and touched a low of 1.5328 early in the week. The pair then reversed directions, pushing to a high of 1.5658, as resistance held firm at 1.5682 (discussed last week). The pair closed the week at 1.5520.
Live chart of GBP/USD: [do action=”tradingviews” pair=”GBPUSD” interval=”60″/]
Technical lines from top to bottom
We begin with 1.6006, which is protecting the symbolic 1.60 level.
1.5909 has held firm as resistance since June.
1.5825 was an important cap in November 2014.
1.5769 is the next resistance line.
1.5682 held firm as the pound posted strong gains. This line was a key resistance line in December 2014 and January 2015.
1.5590 is an immediate line of resistance.
1.5485 has switched to a support level. It is a weak line and could see more action early in the week.
1.5341 continues to be busy, and was tested in support as the pair lost ground before the pound recovered.
1.5269 is next. It was an important support level in March.
1.5163 is a strong support level.
1.5026 has provided support since April and is the final support line for now. It is protecting the symbolic line of 1.50.
I am neutral on GBP/USD.
After a disappointing month of August, the pound has reversed directions and posted a strong rally against the greenback. The Fed non-decision took some air out of the dollar’s tires, and the ensuing market disappointment could bolster the pound.
In our latest podcast we explain why the dollar defies the doves
Further reading:
- For a broad view of all the week’s major events worldwide, read the USD outlook.
- For EUR/USD, check out the Euro to Dollar forecast.
- For the Japanese yen, read the USD/JPY forecast.
- For the kiwi, see the NZD/USD forecast.
- For the Australian dollar (Aussie), check out the AUD to USD forecast.
- For the Canadian dollar (loonie), check out the USD to CAD forecast.
