GBPUSD daily analysis
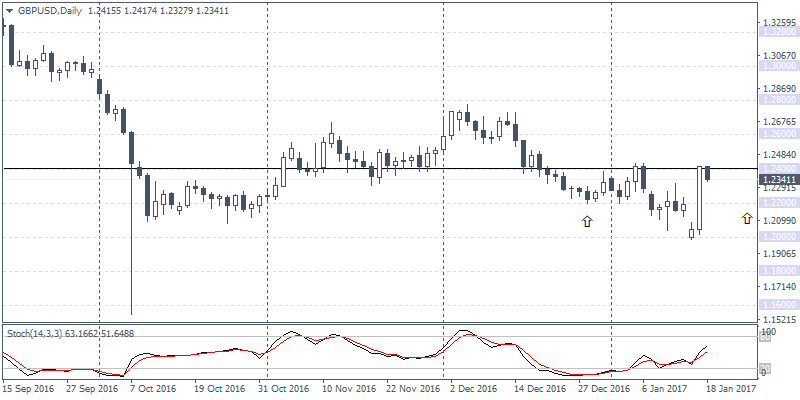
GBPUSD (1.2341): The British pound posted strong gains yesterday, rising from a few pips above $1.2000 to close the day at $1.2400. The gains came as the British PM Theresa May outlined her Brexit vision hoping for a clean break from the EU. Her comments on putting the Brexit deal to a parliamentary vote saw the Cable rally on the day during her speech. Looking ahead, the UK’s jobs report is on the tap today. The GBPUSD daily chart shows the current pullback likely to see a correction back to $1.2200. If this correction is right, GBPUSD could be looking forming a right shoulder for an inverse head and shoulders pattern with the neckline resistance at $1.2400. A reversal off $1.2200 price zone could see GBPUSD position for a move towards $1.2800 at the very least.
USDCHF daily analysis
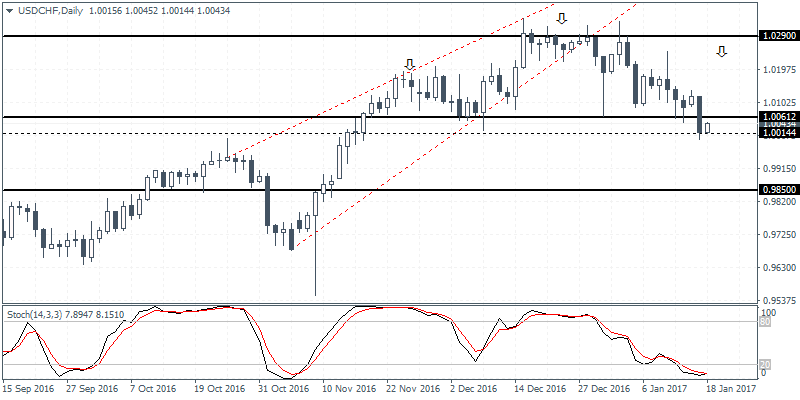
USDCHF (1.0034): USDCHF broke below the 1.0061 support level yesterday with price action showing initial signs of bouncing back. A bullish correction off the 1.0061 – 1.0014 could potentially keep USDCHF biased to the upside with the potential head and shoulders pattern still evolving, although still in the early stages. The daily chart on USDCHF shows the Stochastics moving strongly into the oversold level which could signal a potential slowdown in the momentum as the dollar is likely to post a short term correction. The price zone near 1.0231 – 1.0166 remains the key level where we can expect to see USDCHF post a reversal and thus forming the right shoulder.
EURGBP daily analysis
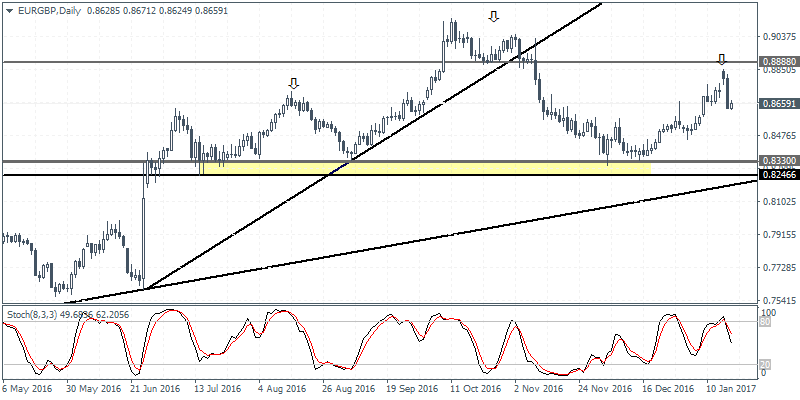
EURGBP (0.8659): EURGBP fell sharply yesterday and gave back the initial gains made earlier in the week on Monday as price gapped higher. The strong declines seen yesterday could potentially mark the start of a new downtrend in EURGBP with the initial support at 0.8330 – 0.8246 likely to be the first price level that could offer a short-term bounce. For the moment, the bearish reversal is showing a potential right shoulder in the head and shoulders pattern which will be validated on a decline towards the neckline support established at 0.8330 – 0.8246.
