- A pullback from five-month highs leads to the sharpest daily decline in gold in two weeks.
- Concerns about Fed rate hikes, US debt ceiling talks, and stimulus hopes dampen risk appetite.
- Sino-American ties may have a long way to go before impressing markets.
The gold price analysis suggests a bearish overview. Although the precious metal pared some losses, rising from $1,849 area.
Early Wednesday morning, gold (XAU/USD) rose modestly around $ 1,855. Tuesday’s session was volatile, with the price falling out of a multi-day high and marking its worst daily loss in two weeks.
–Are you interested to learn more about forex options trading? Check our detailed guide-
Following a two-day uptrend, the metal’s recent consolidation could be attributed to low yields on US Treasuries as well as the US Dollar Index (DXY). After its recent rally to its highs since October 26, the 10-year US Treasury yield has stalled around 1.64%, while the DXY is at its 16-month highs. Furthermore, following the bullish close on Wall Street, gold buyers may also benefit from more robust stock futures.
Mary Daly’s comments contradict St. Louis Fed President James Bullard, former Treasury Secretary Lawrence Summers, and former New York Fed President Bill Dudley, who previously called for a rate hike.
In addition to easing pressure on the Fed to negotiate a debt ceiling extension, this development has encouraged gold buyers. Treasury Secretary Janet Yellen recently announced that the debt ceiling will take a little longer to expire on December 3-15 due to a recent stimulus from US President Biden.
Gold dealers can also recover their losses from the previous day due to the lack of key dates and events in Asia and the lack of serious entertainment from the Biden-Xi negotiations.
In October, US retail sales came in 1.7% m/m above a forecast of 1.4%, which, combined with strong US industrial production and housing data, asked the FRS policymakers to allay concerns about a rate hike.
The light calendar for Wednesday will be dominated by “federal language” to reinforce politicians’ optimism and challenge gold traders.
–Are you interested to learn about forex bonuses? Check our detailed guide-
Gold price technical analysis: Bears to cap gains
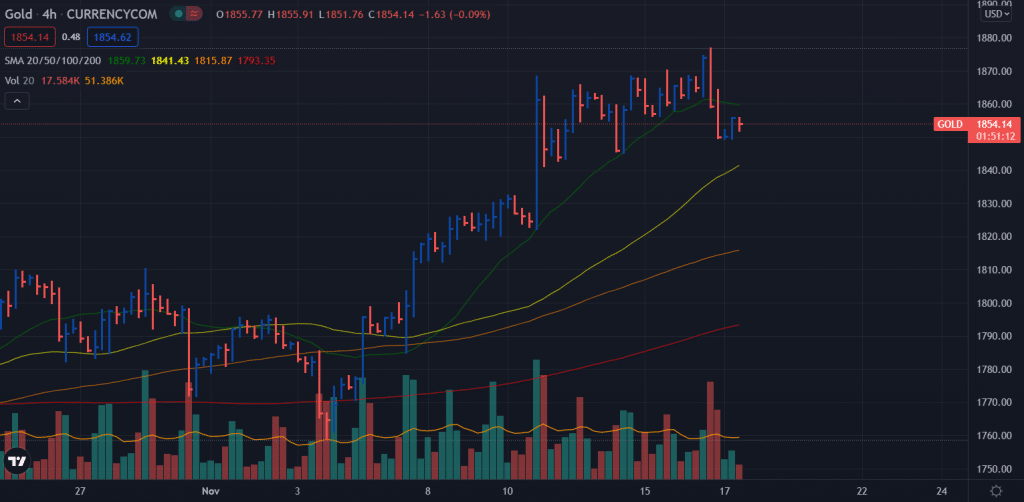
Gold price closed below the 20-period SMA on the 4-hour chart from multi-day highs after breaking the double top at $1,870. This is a bearish indicator as the down bars appeared with huge volume. Although the price found little respite from yesterday’s lows, 20-period SMA will cap further gains. On the downside, the metal may test 50-period SMA around $1,842 ahead of broken structure at $1,830.
Looking to trade forex now? Invest at eToro!
68% of retail investor accounts lose money when trading CFDs with this provider. You should consider whether you can afford to take the high risk of losing your money.
