Hello traders,
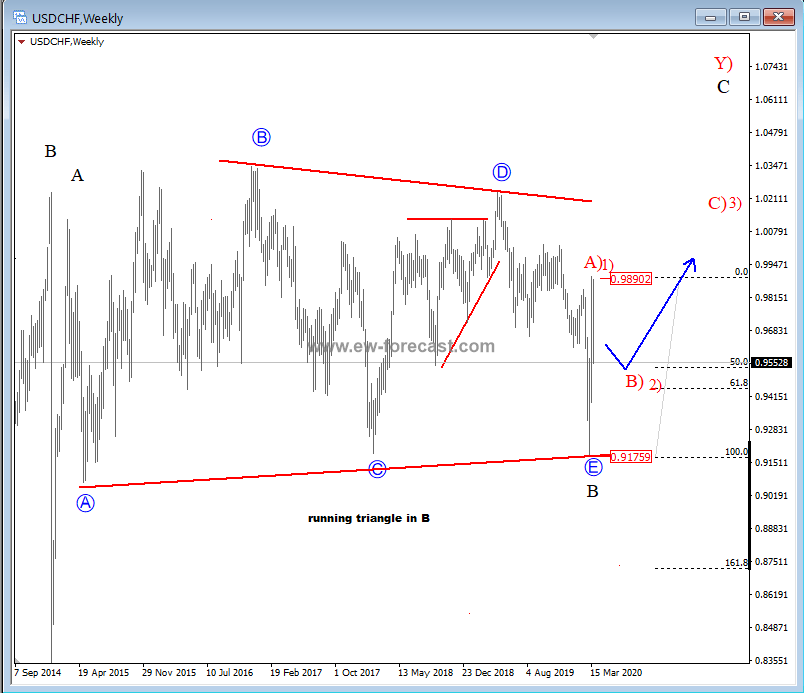
On the weekly chart of USD/CHF, we can see that price was for the last five years making a sideways, and overlapping price activity; an Elliott wave running triangle in B. This triangle can now be completed based on latest sharp recovery from the 0.9176 level, where a low was put into place. If that is the case, then be aware of a minimum three-wave recovery above the 1.023 zones for a higher degree wave C, in weeks/months to come.
That said, let us also be aware of temporary pullbacks, and the first one can already be underway, down from 0.989 level. Support for it can be at the Fib. Ratio of 50.0/61.8 (0.95/0.94 region).
USDCHF, weekly
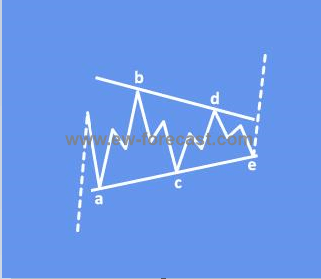
A Triangle is a common 5-wave pattern labeled A-B-C-D-E that moves counter-trend and is corrective in nature. Triangles move within two channel lines drawn from waves A to E, and from waves, B to D. A Triangle is either contracting or expanding depending on whether the channel lines are converging or expanding. Triangles are overlapping five wave affairs that subdivide 3-3-3-3-3, in some cases a leg E can be a triangle itself.
Triangles can occur in wave 4, wave B, wave X position or in some very rare cases also in wave Y of a combination.
A running triangle in an uptrend:
Trade well,
The EW-forecast team
