This week will be shorter, but it does not mean less volatile. Some of the major news expected for the rest of the week is:
Tuesday: PCE Price Index
Thursday: ADP Unemployment
Friday: Nonfarm Payrolls (NFP)
The biggest event of the week is expected to be the NFP on Friday. The Actual is 211K vs. Forecast of 185K and Previous of 79K. The unemployment rate is supposed to stay unchanged at 4.4% and the hourly earnings are expected to rise 0.2%.
The EU Zone will have their respective reports throughout the week. Germany, Spain, France and Italy will have their CPI figures released separately.
Cable traders will be looking for this week’s manufacturing PMI. It is forecast to dip to 56.5 from 57.3. Construction activity is supposed to weaken slightly to 52.7 from 53.1.
Canada is going to release its monthly economic growth figures on Wednesday. The data is supposed to show that the economy expanded 0.2% in March. Now, lets look at some key technical charts for the above-mentioned.
EURUSD
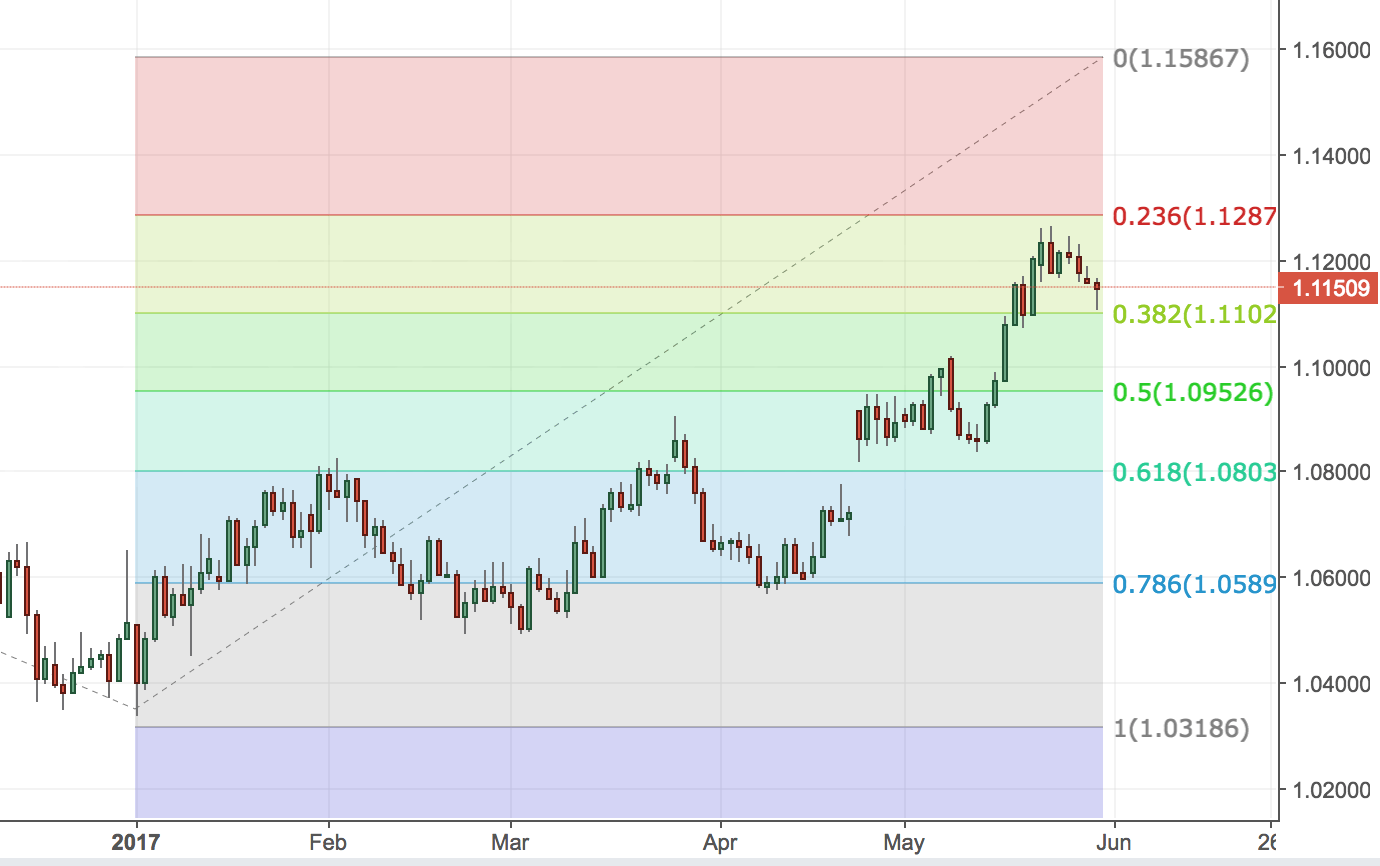
As can be seen from the EURUSD chart above, the 0.50 Fibonacci retracement is located at 1.1000, where is the closest support level, too. One possible scenario is that we might see price dropping to this level before a bounce back. The next resistance level is located at 1.1600. All eyes will be on this pair on Friday because of the NFP report.
GBPUSD
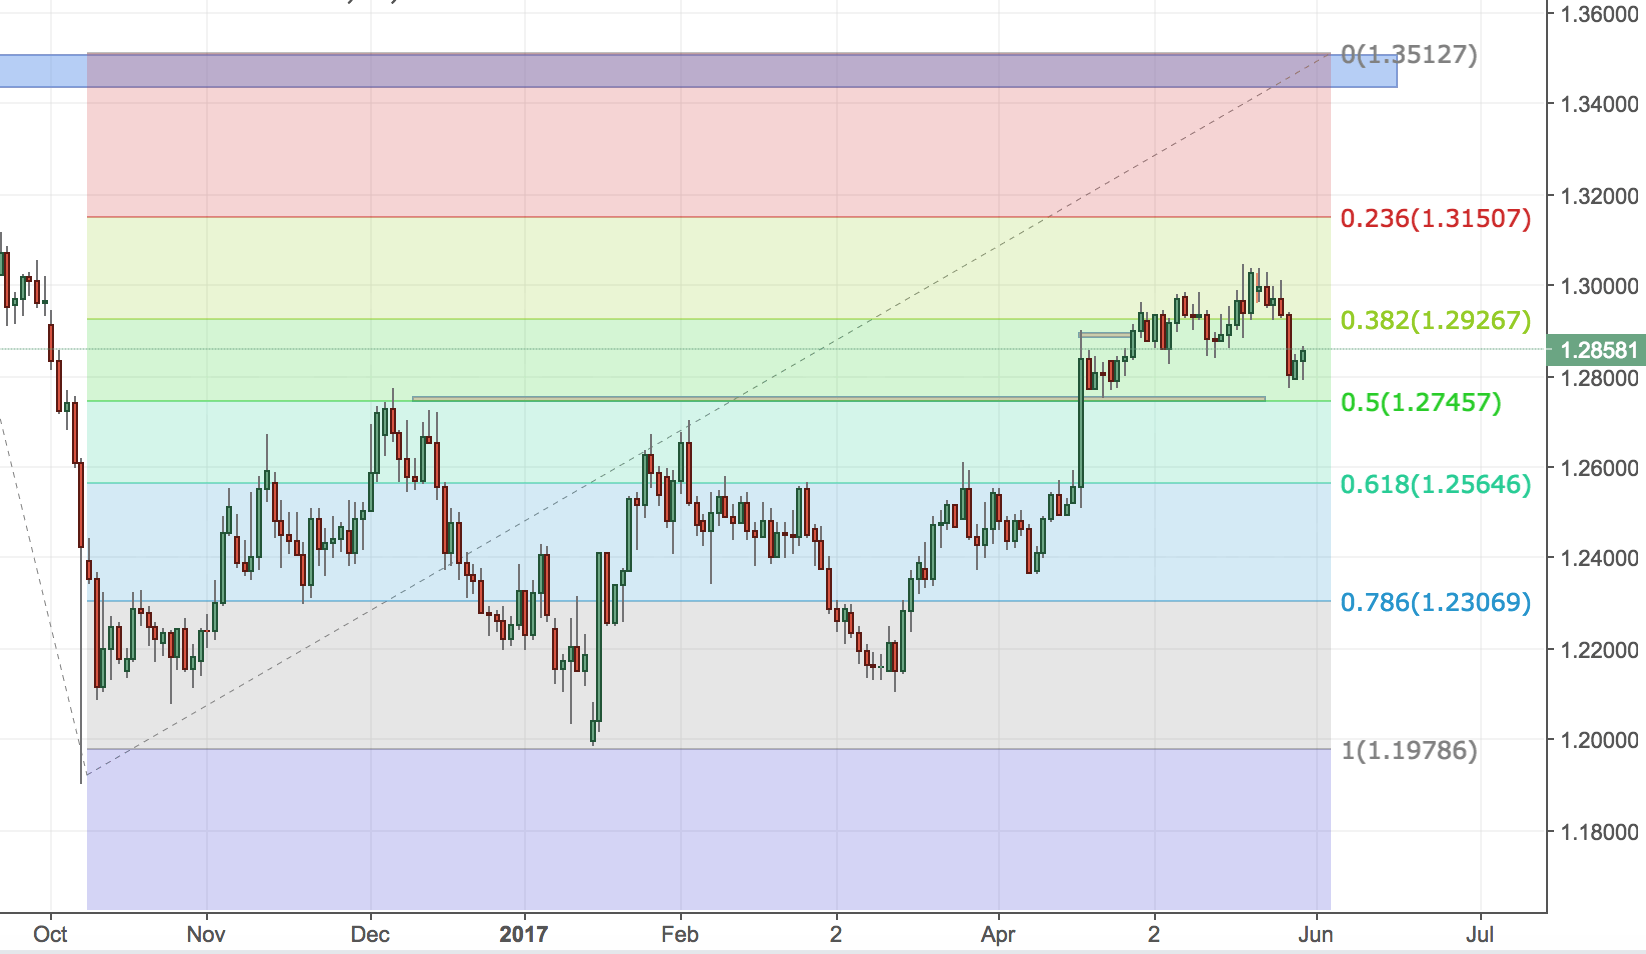
The technical view on GBPUSD is similar to the EURUSD with one major exception. The biggest event for this pair is not necessary this week. The 8th of June election could stir up the direction of this pair until then. From a technical standpoint, we are located just above the .50 Fibonacci retracement level. There is an inside day candlestick bar on the daily timeframe. It is indicative for further bullish action. Again, this is just one possible scenario, since the election results will give further direction of the cable. The next resistance level is located at 1.3500.
USDCAD
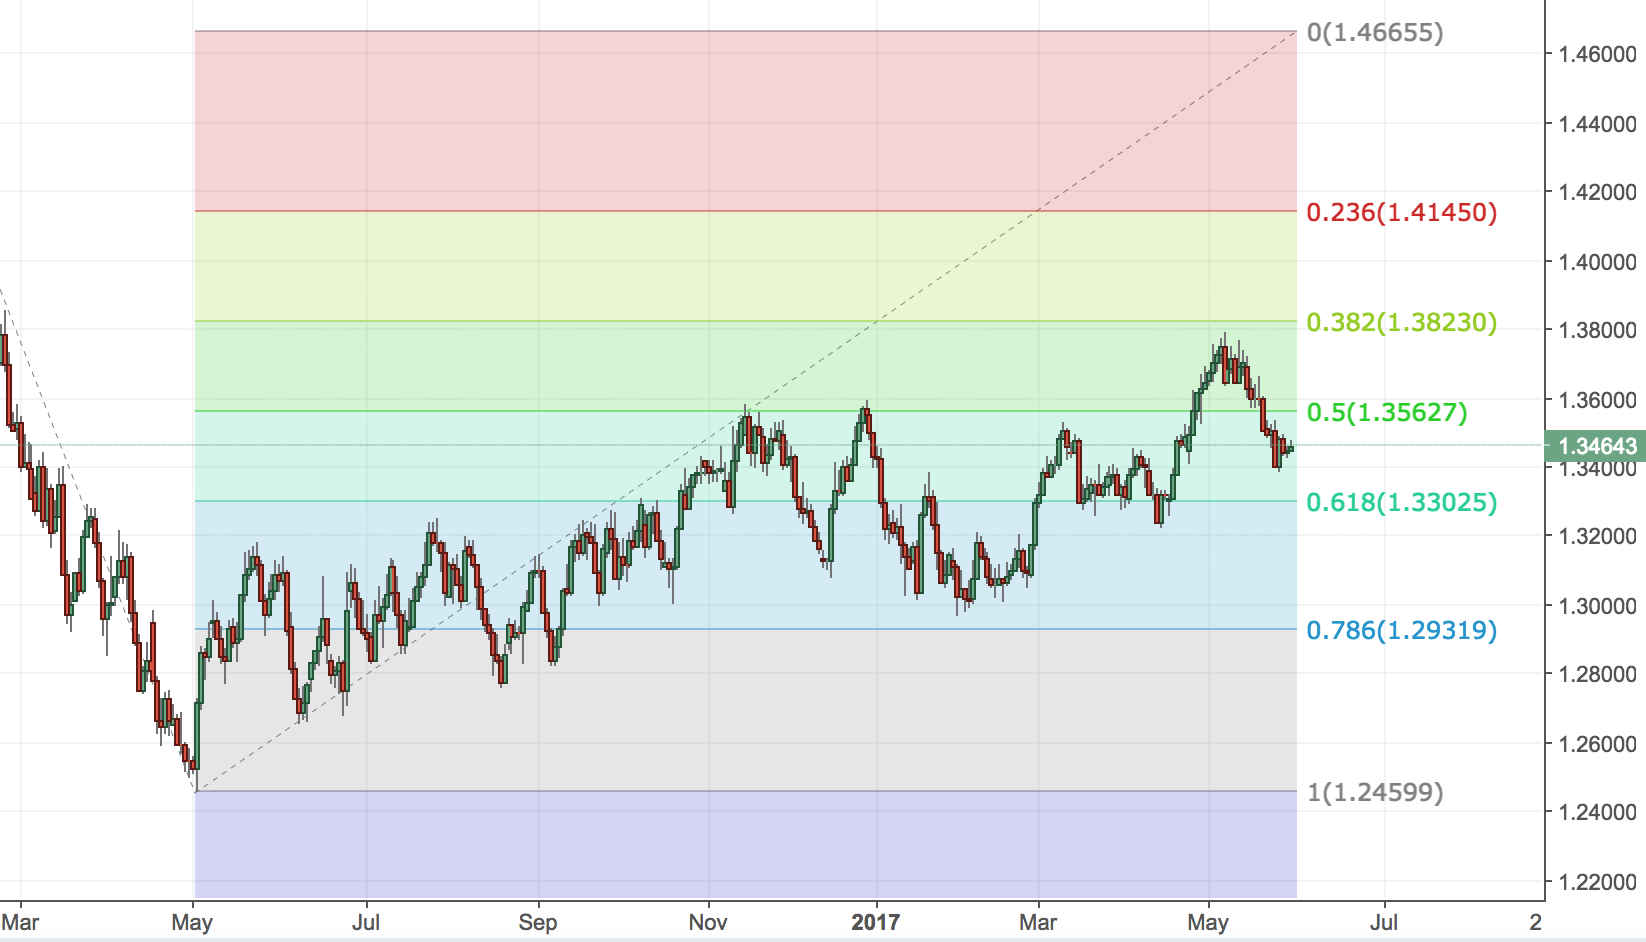
More affirmative action from this pair can be expected after the data release on Wednesday. The technical picture here is showing price action flirting with the 0.50 Fibonacci retracement level (1.4700-1.2450). This could be an indication that after a failed break above the 1.3600 area, more bearish tone is about to dictate the future movement of this pair. I am curious to see how the USDCAD will react with the 1.3600 again and if we see another rejection, this could be a more affirmative sign of future declines. The next major support is the level of 1.2500.
Stay tuned and get more free analysis on www.colibritrader.com
