The New Zealand dollar experienced some fluctuations on the background of retail sales. The highlights are the milk auction and inflation expectations. Here is an analysis of fundamentals and an updated technical analysis for NZD/USD.
Chinese data, including weak PPI and a shrink in exports had some negative impact on the kiwi, especially after the big yuan devaluation. After falling to new lows, sentiment changed and the move was perceived as USD negative, helping the pair recover. Good US data balanced the picture once again. Another blow to the kiwi came from poor retail sales. The economy doesn’t look good.
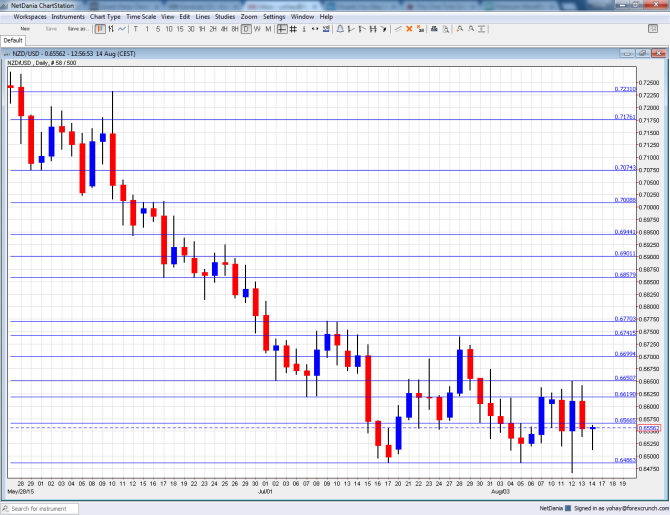
[do action=”autoupdate” tag=”NZDUSDUpdate”/]NZD/USD daily graph with support and resistance lines on it. Click to enlarge:
- GDT Price Index: Tuesday. This bi-weekly indicator of dairy prices, New Zealand’s prime export, has a big impact on the kiwi, and of late, a negative one. In the past 10 auctions, prices have fallen, and this includes the last plunge of 9.3%. Will we see a bounce now?
- PPI: Tuesday, 22:45. As with other figures, producer prices are released only once per quarter, making them important. PPI Input fell in the past 4 quarters, and this was disappointing each time. After a big loss of 1.1% in Q1, a more moderate slide is on the cards now. PPI Output dropped by 0.9% and could follow the same path.
- Visitor Arrivals: Thursday, 22:45. Tourism also plays a role in the economy. After a slide of 0.2% in June, we could see the same kind of stability in July.
- Credit Card Spending: Friday, 3:00. With retail sales published only once per quarter, this measure of spending provides updated data. A healthy year over year rise of 6.5% was seen in June and a slightly slower growth rate could be seen now.
NZD/USD Technical Analysis
Kiwi/dollar was unable to extend its gains early in the week and eventually began sliding towards 0.6560 (a line mentioned last week). The fall to new lows was followed by a new cling to this historic level.
Live chart of NZD/USD:
[do action=”tradingviews” pair=”NZDUSD” interval=”60″/]Technical lines, from top to bottom:
We start from a lower point this time. 0.7075 provided some support in May and is a weak level now. And of course, the very round level of 0.70 looms large and gave a fight before the pair continued south in June.
Further, the low of 0.6940 allowed for a temporary bounce. The round 0.69 level is switched positions to resistance.
0.6860 was a low point as the pair dropped in June 2015. It is followed by the 0.68 level that worked as resistance when the pair was climbing a few years back.
Close by, the July high of 0.6770 serves as resistance. Quite close by, the high of 0.6740 seen in July is another cap.
It is followed by the round level of 0.67 that is a pivotal line in the range. The now previous July low of 0.6650 was a multi-year low and the break below it was not confirmed.
0.6620 is the new 2015 low and for now serves as minor support. The post crisis low of 0.6560 is still of high importance.
Below, the round 0.65 level is of high importance now. The last line is 0.64886, which was the low both in July and in August – a double bottom.
There isn’t much on the way down. 0.6160 can be noted as a post crisis attempt to recover.
I remain bearish on NZD/USD
With a lack of positive news for the New Zealand economy and a growing notion of a Fed hike in September, we could see further losses for the pair. The slowdown in China is negative for New Zealand and apparently also milk, which used to be less influenced by other commodity prices, is now spilling lower with other commodities.
In our later podcast we discuss predictable currencies vs. unpredictable central banks.
Further reading:
- For a broad view of all the week’s major events worldwide, read the USD outlook.
- For EUR/USD, check out the Euro to Dollar forecast.
- For the Japanese yen, read the USD/JPY forecast.
- For GBP/USD (cable), look into the British Pound forecast.
- For the Australian dollar (Aussie), check out the AUD to USD forecast.
- For USD/CAD (loonie), check out the Canadian dollar forecast.
