The New Zealand dollar does not see any bottom in sight. Another week saw new multi-year lows as the post-crisis low gets close. Where will this stop? Here is an analysis of fundamentals and an updated technical analysis for NZD/USD.
For the 7th consecutive time, milk prices fell and the kiwi suffered. This time, the GDP price index slipped by no less than 5.9%. But that was not the only thing weighing on the kiwi: the ANZ Business Index dropped all the way to -2.3 points. The negative number implies pessimism. In addition, NZD/USD suffered from the dollar’s strength, thanks in part to some good US figures (despite the unimpressive NFP) and also because of the escalation in the Greek crisis.
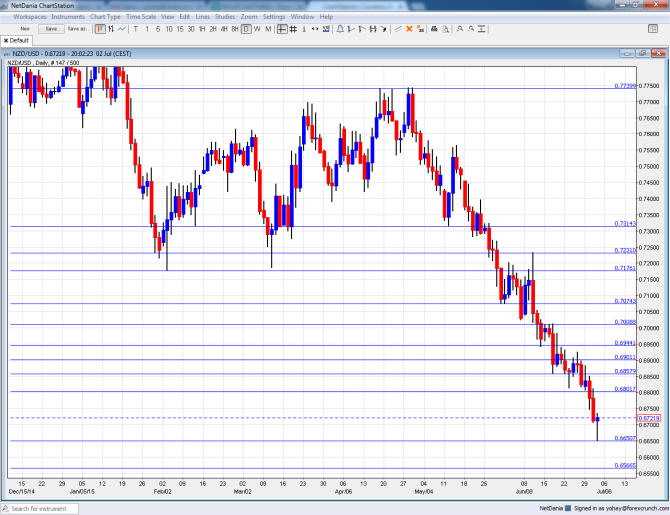
[do action=”autoupdate” tag=”NZDUSDUpdate”/]NZD/USD daily graph with support and resistance lines on it. Click to enlarge:
- NZIER Business Confidence: Monday, 22:00. After the weak ANZ number, this publication becomes even more important, especially as this is a quarterly release. The 2500 strong survey stabilized at 23 points in Q1 points, reflecting moderate optimsim but staying away from the high levels seen in 2014. Will it drop to a negative number now?
NZD/USD Technical Analysis
Kiwi/dollar started off the week with a slide to the downside and could never recover. IT reached a low of 0.6650, which is a new line that didn’t appear last week.
Live chart of NZD/USD:
[do action=”tradingviews” pair=”NZDUSD” interval=”60″/]Technical lines, from top to bottom:
We start from lower ground: 0.7315, which supported the pair in May and later capped a recovery attempt is strong resistance. One of the stops on the downside, 0.7235 was also a swing high in June.
It is followed by 0.7160 that served as resistance back in 2010 and was the low in January. Lower, the round level of 0.71 used to provide support in the past but was eventually breached.
0.7075 provided some support in May and is a weak level now. And of course, the very round level of 0.70 looms large and gave a fight before the pair continued south in June.
Further, the low of 0.6940 allowed for a temporary bounce. The round 0.69 level is switched positions to resistance.
0.6860 was a low point as the pair dropped in June 2015. It is followed by the 0.68 level that worked as resistance when the pair was climbing a few years back.
The new July low of 0.6650 is a multi-year low and the last line of support before the post crisis low of 0.6560.
I remain bearish on NZD/USD
It isn’t only the RBNZ anymore. The prospects of the New Zealand economy are not looking too good, with a slowdown in China, falling milk prices, a slowing housing market and more. In the US, the Fed remains on track for a hike in September, and that’s enough to keep the downside pressure on the pair.
In our latest podcast we feature a Greferendum preview, NFP review and more
Follow us on Sticher.
Further reading:
- For a broad view of all the week’s major events worldwide, read the USD outlook.
- For EUR/USD, check out the Euro to Dollar forecast.
- For the Japanese yen, read the USD/JPY forecast.
- For GBP/USD (cable), look into the British Pound forecast.
- For the Australian dollar (Aussie), check out the AUD to USD forecast.
- For USD/CAD (loonie), check out the Canadian dollar forecast.
