The New Zealand dollar was looking to recover but eventually closed in the same level. Milk prices and business confidence stand out. Here is an analysis of fundamentals and an updated technical analysis for NZD/USD.
New Zealand visitor arrivals rose by 0.2% in October, lower than beforehand. Trade balance came out in a deficit, but was smaller than expected. In the US, data was OK, continuing to support a rate hike.
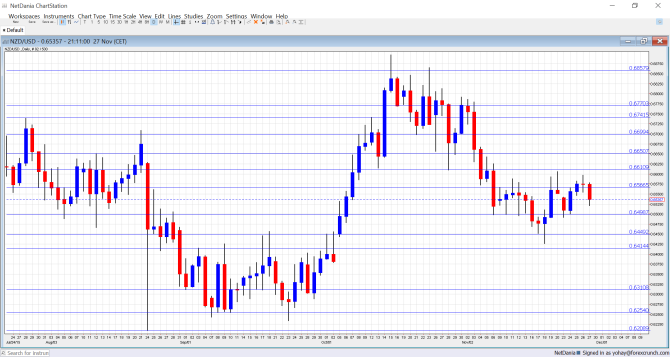
[do action=”autoupdate” tag=”NZDUSDUpdate”/]NZD/USD daily graph with support and resistance lines on it. Click to enlarge:
- Building Consents: Sunday, 21:45. Despite being quite volatile, this figure provides an indication on the housing sector. After a drop of 5.7% in September, we may see a rise now.
- ANZ Business Confidence: Monday, 00:00. After 4 months of negative figures, this important 1500 strong survey returned to positive ground with a score of 10.5 points in October. A similar figure is on the cards for November.
- Overseas Trade Index: Monday, 21:45. The indicator, also known as Terms of Trade, surprised in Q2 with a rise of 1.3%, beating expectations for a drop. Will the weak kiwi dollar result in another rise in Q3? Expectations stand at a drop of 2.5%.
- GDT Price Index: Tuesday. The bi-weekly Global Dairy Trade certainly moves the kiwi. Milk prices haven fallen in the past three auctions, with a significant plunge of 7.9% last time.
- ANZ Commodity Prices: Wednesday, 00:00. New Zealand’s economy is commodity oriented, making this figure important, albeit somewhat overshadowed by milk prices. A rise of 6.9% was recorded in October and a fall could be seen in November.
NZD/USD Technical Analysis
Kiwi/dollar lost the 0.65 support line (mentioned last week) and struggled to recover.
Live chart of NZD/USD:
[do action=”tradingviews” pair=”NZDUSD” interval=”60″/]Technical lines, from top to bottom:
0.7075 is where the pair found support back May. It is naturally followed by the very round level of 0.70.
The low of 0.6940 allowed for a temporary bounce. The round 0.69 level has switched positions to resistance.
0.6860 was a low point as the pair dropped in June 2015. It is followed by the 0.68 level that worked as resistance when the pair was climbing a few years back.
Close by, the July high of 0.6770 serves as resistance. Quite close by, the high of 0.6740 seen in July is another cap.
It is followed by the round level of 0.67 that was a pivotal line in the high range. Another line worth noting is 0.6640, which capped the pair in November.
The post crisis low of 0.6560 is still of importance. Below, the round 0.65 level is of high importance now, serving as support.
A minor line is the October swing high of 0.6440. 0.6408 is the next line of support.
Below, 0.6310 provides some support after doing so in early September and the round 0.60 level is the line in the sand.
I turn bearish on NZD/USD
While New Zealand is doing OK, it seems that it will not be able to withstand the strength of the US dollar in a busy week. It seems that only overwhelmingly strong data from milk prices and business confidence would be able to stabilize the pair.
In this week’s podcast we guide you through the upcoming storm: ECB, NFP, OPEC and more
Follow us on Sticher or on iTunes
Further reading:
- For a broad view of all the week’s major events worldwide, read the USD outlook.
- For EUR/USD, check out the Euro to Dollar forecast.
- For the Japanese yen, read the USD/JPY forecast.
- For GBP/USD (cable), look into the British Pound forecast.
- For the Australian dollar (Aussie), check out the AUD to USD forecast.
- For USD/CAD (loonie), check out the Canadian dollar forecast.
