The New Zealand dollar chopped around after the employment data. 3 events are lined up now. Here is an analysis of fundamentals and an updated technical analysis for NZD/USD.
Milk prices fell again, and this time by 7.4%. In addition, employment dropped by 0.4%, much worse than expected. Together with an excellent jobs report in the US, the ground was set for the big fall of the kiwi.
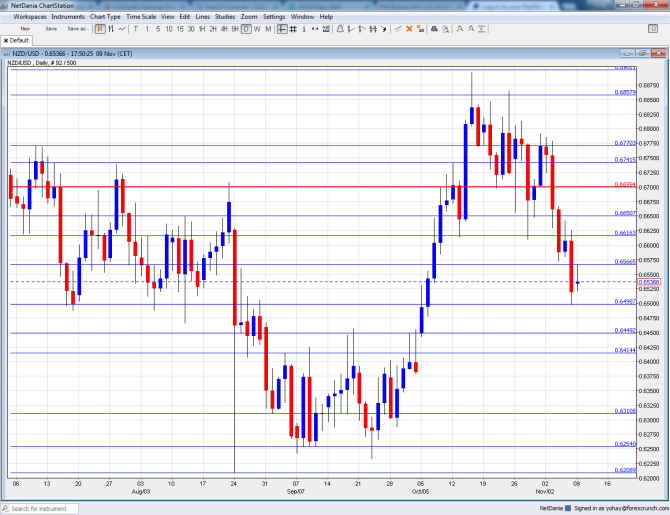
[do action=”autoupdate” tag=”NZDUSDUpdate”/]NZD/USD daily graph with support and resistance lines on it. Click to enlarge:
- RBNZ Financial Stability Report: Tuesday, 20:00. The Reserve Bank of New Zealand releases this closely watched report twice a year. While it focuses on financial conditions, the report also touches on inflation and growth forecasts, and perhaps hints about monetary policy.
- Business NZ Manufacturing Index: Wednesday, 21:30. This PMI like indicator remained at a stable 55.4 points in September. Will it drop now?
- FPI: Wednesday, 21:45. New Zealand exports a lot of food, mostly dairy products, making this measure important. After a slide of 0.5% in September, some stability is on the cards now.
NZD/USD Technical Analysis
Kiwi/dollar began the week trading below 0.6770 (mentioned last week). It then collapsed and even slid under 0.65 before stabilizing.
Live chart of NZD/USD:
[do action=”tradingviews” pair=”NZDUSD” interval=”60″/]Technical lines, from top to bottom:
0.7075 is where the pair found support back May. It is naturally followed by the very round level of 0.70.
The low of 0.6940 allowed for a temporary bounce. The round 0.69 level is switched positions to resistance.
0.6860 was a low point as the pair dropped in June 2015. It is followed by the 0.68 level that worked as resistance when the pair was climbing a few years back.
Close by, the July high of 0.6770 serves as resistance. Quite close by, the high of 0.6740 seen in July is another cap.
It is followed by the round level of 0.67 that is a pivotal line in the range. The now previous July low of 0.6650 was a multi-year low and the break below it was not confirmed.
0.6615 was a low point in October and is closely watched. The post crisis low of 0.6560 is still of high importance.
Below, the round 0.65 level is of high importance now. The last line is 0.6488, which was the low both in July and in August – a double bottom.
Minor resistance can be found at the October swing high of 0.6440. 6408 works as a pivotal line. Below, 0.6310 provides some support after doing so in early September.
I remain bearish on NZD/USD
Everything leads to another rate cut in New Zealand. The economy isn’t doing too bad, but the direction doesn’t look good. Adding the expected hike in the US, we have a scenario for more falls.
In our latest podcast we explain how to trade the euro printing machine:
Follow us on Sticher or on iTunes
Further reading:
- For a broad view of all the week’s major events worldwide, read the USD outlook.
- For EUR/USD, check out the Euro to Dollar forecast.
- For the Japanese yen, read the USD/JPY forecast.
- For GBP/USD (cable), look into the British Pound forecast.
- For the Australian dollar (Aussie), check out the AUD to USD forecast.
- For USD/CAD (loonie), check out the Canadian dollar forecast.
