Hello traders,
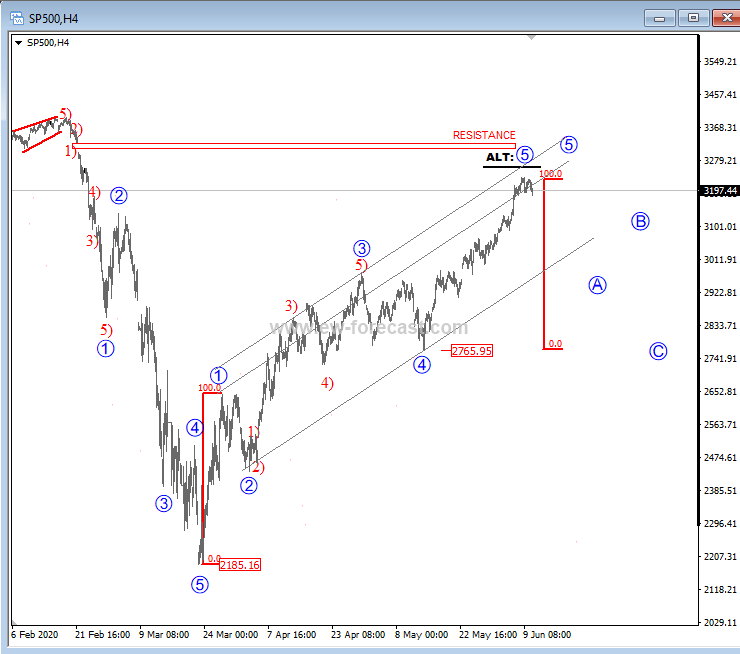
S&P500 is making a fifth wave higher, up from 2765 level. A wave 5 is an impulse, a five-legged move, and can once completed push price into a minimum three-wave turn. This turn as visible on the 4h charts, can happen from around the 3230/3320 zone.
S&P500, 4h
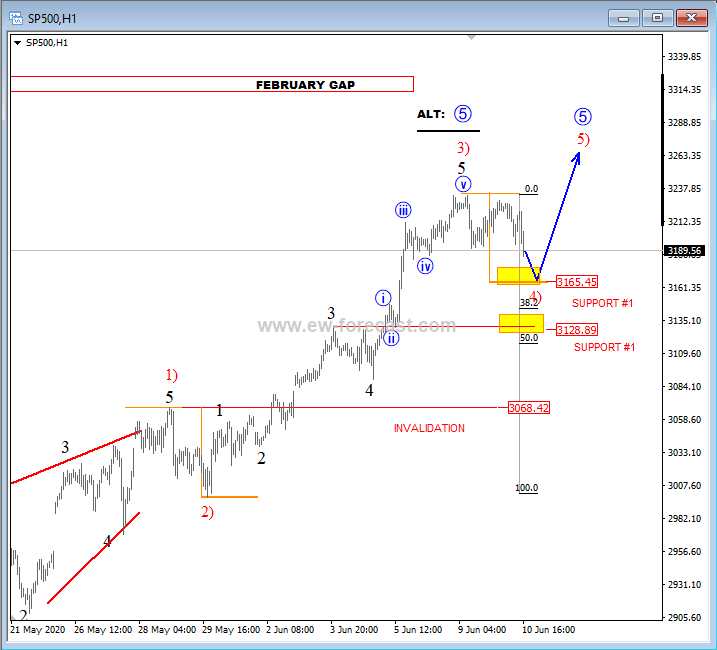
On the intra-day chart, we see price making an intra-day decline, down from 3230 current high, suggesting that sub-wave 4) correction of 5 is underway. Wave 4) is a correction, a pause, and can take price towards first possible support at 3165, or lower towards the 3128 level. We also see Fib. Ratios at the mentioned zone, which can provide good turning points for a fifth wave higher.
All being said, once wave 4) fully develops, and we see a strong rally, and a break above 3230 high, that is when wave 5) of 5 will be underway. In case we see only a further drop below the 3068 level, than current 3230 high would be a completed fifth wave, and we would be observing a bigger, three-wave decline.
S&P500, 1h
Trade well.
