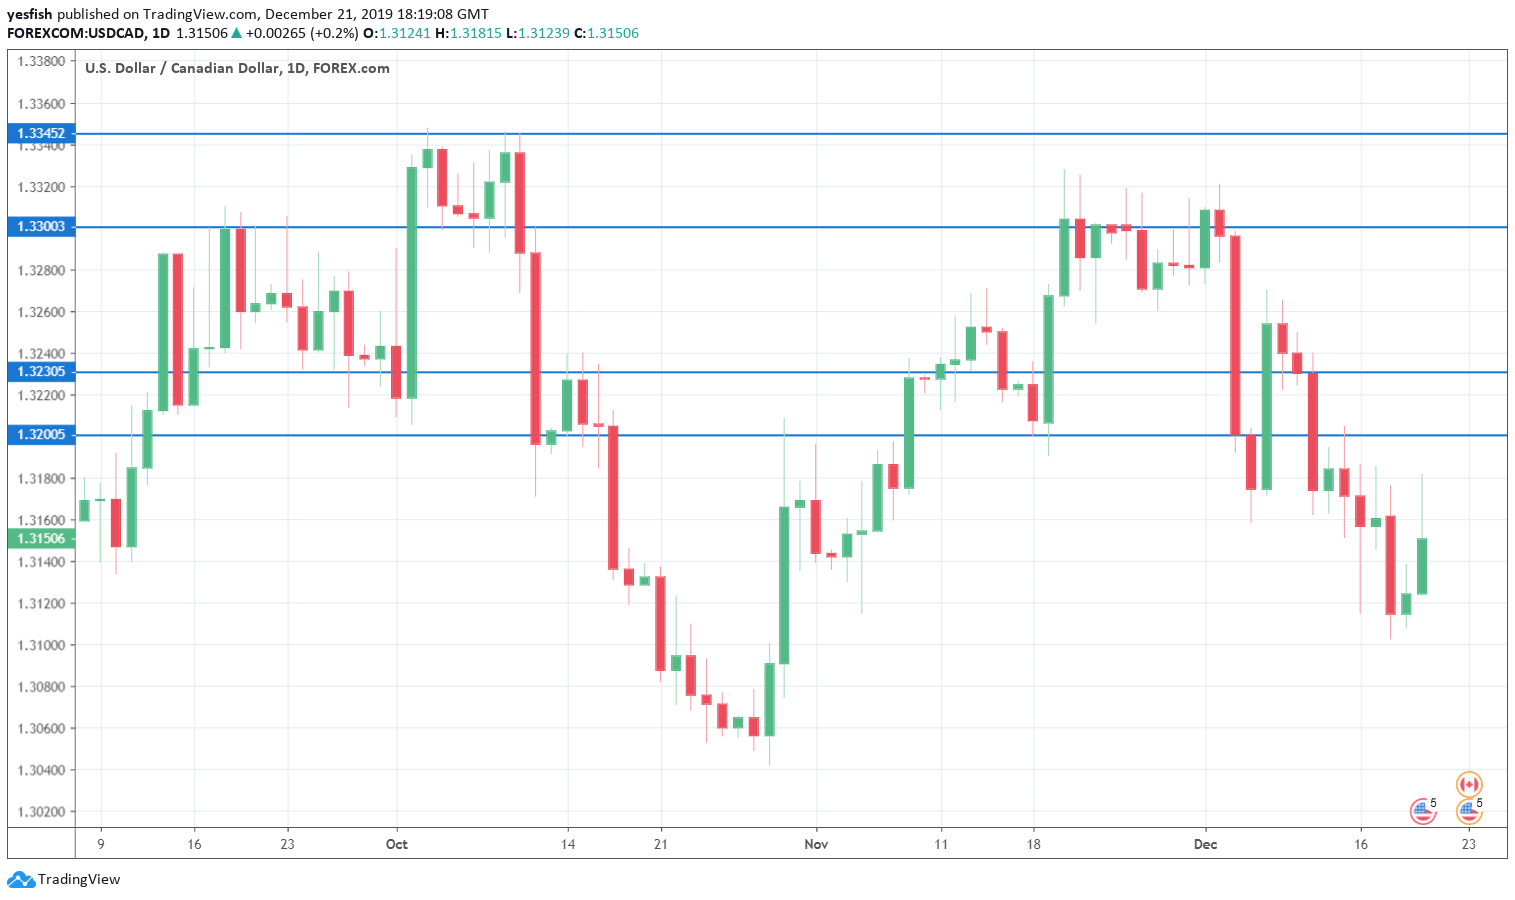
USD/CAD daily chart with support and resistance lines on it. Click to enlarge:
USD/CAD posted slight losses last week, marking the fourth successive winning week for the Canadian dollar. The upcoming week has only one event, Canadian GDP. Here is an outlook at the highlights and an updated technical analysis for USD/CAD.
In Canada, the focus was on consumer spending and inflation data. Consumer inflation declined by 0.1% in November, marking its third decline in four months. Core CPI, which excludes the most volatile items included in CPI, declined by 0.2%, compared to a +0.4% reading a month earlier. Retail sales fell sharply, with a reading of -1.2%. This marked a third straight decline. The core release declined by 0.5%, well off the forecast of +0.2%.
In the U.S., manufacturing PMI improved to 52.5 in December, just shy of the estimate of 52.6 pts. This was the indicator’s strongest gain since March. The week ended with Final GDP, which was unrevised at 2.1 percent. This is indicative of a U.S. economy that is performing well.
- GDP: Monday, 13:30. Canada releases GDP reports on a monthly basis. The economy has showed slow growth, with back-to-back gains of 0.1%, and an identical figure is projected in October.
USD/CAD Technical Analysis
Technical lines from top to bottom:
We start with resistance at 1.3550.
1.3445 has remained intact since the first week of June. 1.3385 is next.
The round number of 1.3300 continues to be a resistance line.
1.3265 has some breathing room in resistance.
1.3150 remains relevant. The pair ended the week at this line.
1.3100 (mentioned last week) has held in support since the end of October, when USD/CAD started an extensive rally.
1.3048 is protecting the round number of 1.3000, which has psychological significance.
1.2916 was last tested in October 2018.
1.2830 is the final support level for now.
I remain bearish on USD/CAD
The Canadian dollar has managed to post gains of 1.0% in December, and the upward momentum could continue. The U.S. and China finally wrapped up the “Phase 1” trade deal, which has boosted investor risk appetite. As well, crude oil has pushed above $61, which is good news for Canada, which is a major oil producer. Higher oil prices are therefore bullish for the Canadian dollar.
Further reading:
- EUR/USD forecast – for everything related to the euro.
- GBP/USD forecast – Pound/dollar predictions
- USD/JPY forecast – analysis for dollar/yen
- AUD/USD forecast – projections for the Aussie dollar.
- Forex+ weekly forecast – Outlook for the major events of the week.
Safe trading!
