Dollar/CAD collapsed in the last week of 2017, falling back two months. The loonie enjoyed rising oil prices and the weakness of the USD. After no Canadian figures were released in the holiday week, the first week of 2018 provides the all-important jobs report and quite a few other indicators. Here are the highlights and an updated technical analysis for USD/CAD.
Oil prices rose higher thanks to issues in Libya and the C$ took advantage of this. WTI flirted with $60 in the highest trading levels since 2015. The US dollar suffered an end-of-year sell-off after it had already enjoyed a rally related to the tax cuts.
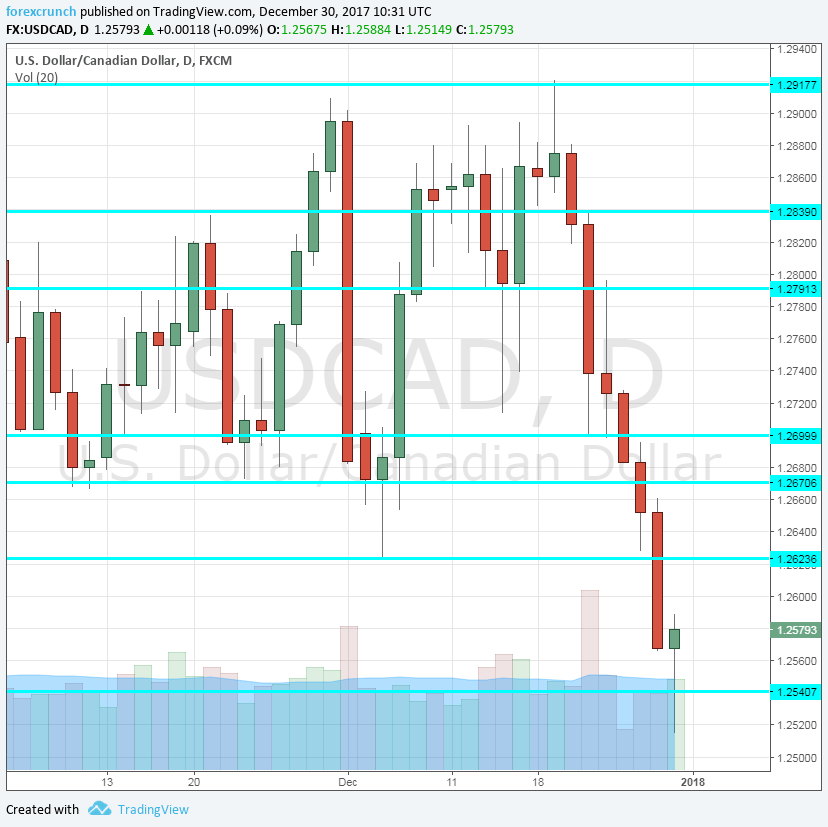
[do action=”autoupdate” tag=”EURUSDUpdate”/]USD/CAD daily graph with support and resistance lines on it. Click to enlarge:
- Manufacturing PMI: Tuesday, 14:30. Markit’s measure of the manufacturing sector remained stable in November, scoring 54.4 points. This reflects OK growth. A small rise may be seen now.
- RMPI: Thursday, 13:30. The Raw Materials Price Index is important for Canada and its crude oil exports.
- Canadian jobs report Friday, 13:30. Canada’s job market enjoyed an excellent month in November: no less than 79.5K positions were gained and the unemployment rate fell to 5.9%. This came after a few not-so-great months for the economy, but perhaps it is picking up once again. The publication for December will test if November’s report was the beginning of a trend or a one-off. A small drop of 2.5K jobs is forecast now while the unemployment rate is projected to rise to 6%.
- Trade Balance: Friday, 13:30. Though somewhat overshadowed by the employment report, the trade balance is still of importance. The deficit narrowed to 1.5 billion in October, the lowest in five months. Will Canada return to a surplus? A deficit of 1.3 billion is on the cards.
- Ivey PMI: Friday, 15:00. The Richard Ivey School of Business continued showing significant optimism in its 175-strong survey. The score of 63 points in November shows robust growth. A slide to 62.2 points is predicted.
* All times are GMT
USD/CAD Technical Analysis
Dollar/CAD initially dropped to support at 1.27 (discussed last week) before extending its falls and losing the important 1.2625 level.
Technical lines from top to bottom:
1.3160 provided support back in June. 1.3020, just above the round level of 1.30, worked as resistance back in July.
1.2920 capped the pair in late October and turned into a double-top in No. It is followed by 1.2840 capped the pair in mid-November and also had a role in the past.
1.2790 was the high in mid-November and serves as resistance. 1.2665 was a was a double-bottom in November and works as strong support.
It is followed by 1.26, a round number that worked as resistance in October. 1.2540 capped the pair in early October when it traded in a narrow range.
1.2435 was a cushion for the pair during the month of October. 1.2335 gave support to the pair in late September.
I am bearish on USD/CAD
The Canadian economy is picking up once again, giving reasons to believe that the loonie can extend its gains even if oil prices do not go anywhere fast.
Our latest podcast is titled What does 2018 have in store for financial markets?
Follow us on Sticher or iTunes
Further reading:
- EUR/USD forecast – for everything related to the euro.
- GBP/USD forecast – Pound/dollar predictions
- USD/JPY forecast – analysis for dollar/yen
- AUD/USD forecast – projections for the Aussie dollar.
- Forex weekly forecast – Outlook for the major events of the week.
Safe trading!
