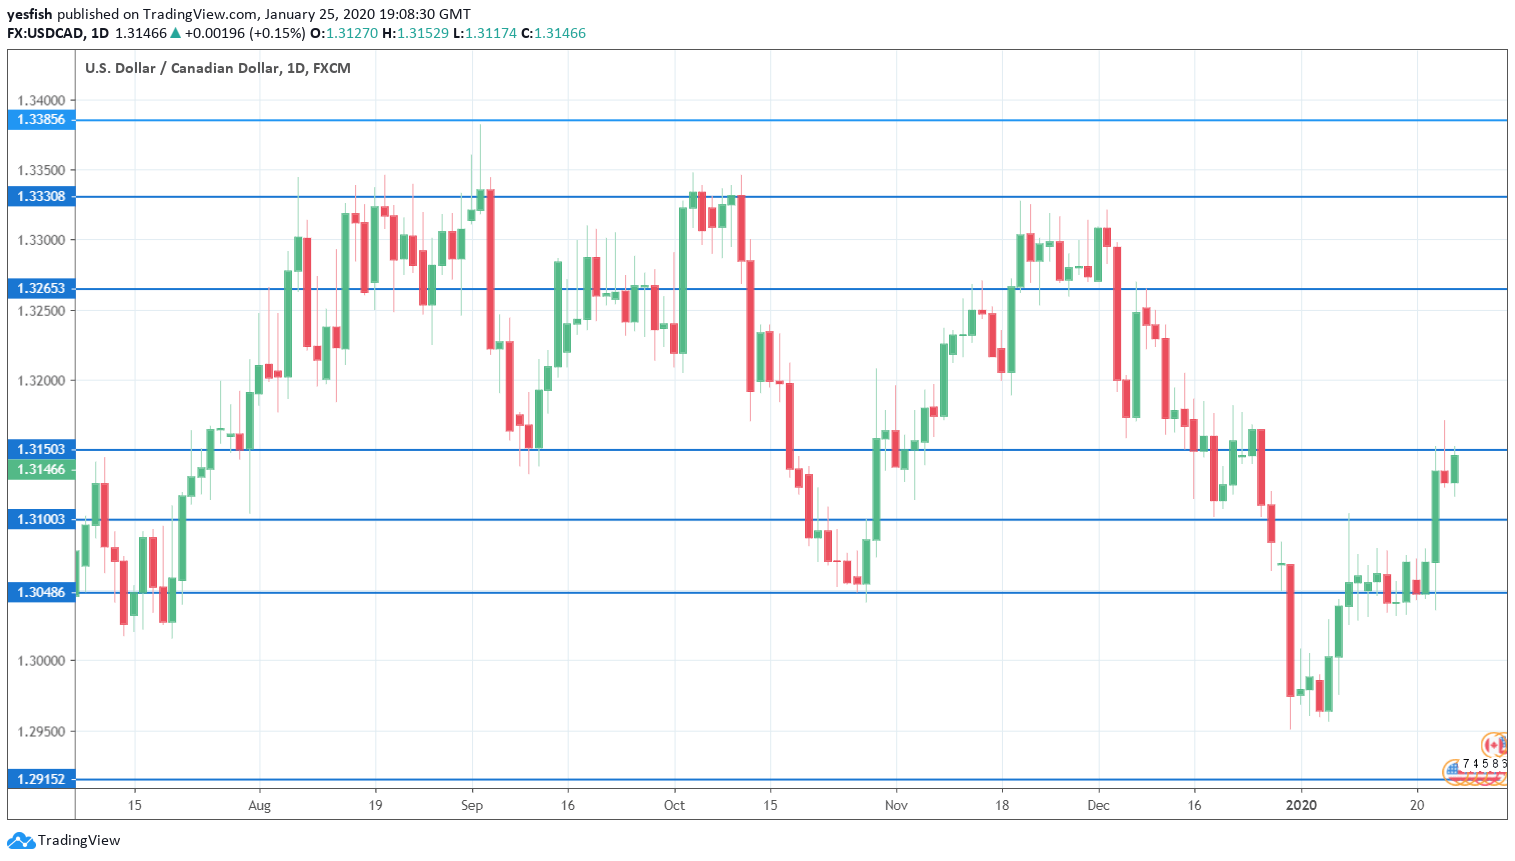
USD/CAD daily chart with support and resistance lines on it. Click to enlarge:
USD/CAD posted gains for a third straight week. The upcoming week features GDP, which should be treated as a market-mover. Here is an outlook at the highlights and an updated technical analysis for USD/CAD.
There were no surprises from the Bank of Canada, which held the benchmark rate at 1.75%. Consumer inflation stalled at 0.0%, matching the estimate. Core CPI, which excludes the most volatile items that make up CPI, slipped to -0.4%. The week wrapped up with retail sales, which jumped 0.9%. above the estimate of 0.6%. It marked the strongest gain in eight months. The core release gained 0.2%, after a decline of 0.5% a month earlier. This fell short of the forecast of 0.5%.
It was a light week on the fundamentals front in the United States. Unemployment claims came in at 211 thousand, lower than the estimate of 214 thousand. The indicator has now beaten the forecast for a third straight week. The manufacturing PMI slowed in January, coming in at 51.7 pts. This marked a 3-month low and missed the forecast of 52.4 pts. There was better news in the services sector, as services PMI improved from 52.2 to 53.2, which was above the estimate of 52.9 pts. This marked a 10-month high.
- GDP: Friday, 13:30. Canadian GDP is released on a monthly basis. The economy contracted by 0.1% in October, its first decline since March. Will we see a rebound in November?
- Raw Materials Price Index: Friday, 13:30. This key inflation indicator rebounded in November, with a strong gain of 1.5 percent. This followed a sharp decline of 1.9% in October. We now await the December release.
USD/CAD Technical Analysis
Technical lines from top to bottom:
We start with resistance at 1.3445, which has remained intact since June 2019. 1.3385 is next.
The round number of 1.3300 has served in a resistance role since early December. 1.3265 follows.
1.3150 switched to a resistance role in the last week of December. It starts the week under strong pressure.
1.3100 (mentioned last week) has switched to a support level after gains by USD/CAD last week.
1.3048 is the next support level.
1.2916 has provided support since October 2018. 1.2830 is next.
1.2730 has held in support since May 2018. it is the final support level for now.
I am bullish on USD/CAD
The recent outbreak of the coronavirus in China has spread to other countries, including the U.S. This has dampened risk appetite, as there are fears of a mass epidemic. Investors are sticking to safe-haven assets, at the expense of riskier assets such as the Canadian dollar.
Further reading:
- EUR/USD forecast – for everything related to the euro.
- GBP/USD forecast – Pound/dollar predictions
- USD/JPY forecast – analysis for dollar/yen
- AUD/USD forecast – projections for the Aussie dollar.
- Forex+ weekly forecast – Outlook for the major events of the week.
Safe trading!
