Dollar/CAD moved up and down as the US announced tariffs on China and Canada had a turbulent Friday. What’s next? Monthly GDP stands out in the last week of September. Here are the highlights and an updated technical analysis for USD/CAD.
NAFTA talks are moving slowly and have moved to the backburner for now. Another trade front has warmed up: the US announced new tariffs on Chinese goods worth $200 billion. The duties come into effect on September 24th. Markets took it with a relative stride. Rising oil prices supported the greenback. Canadian inflation data beat expectations
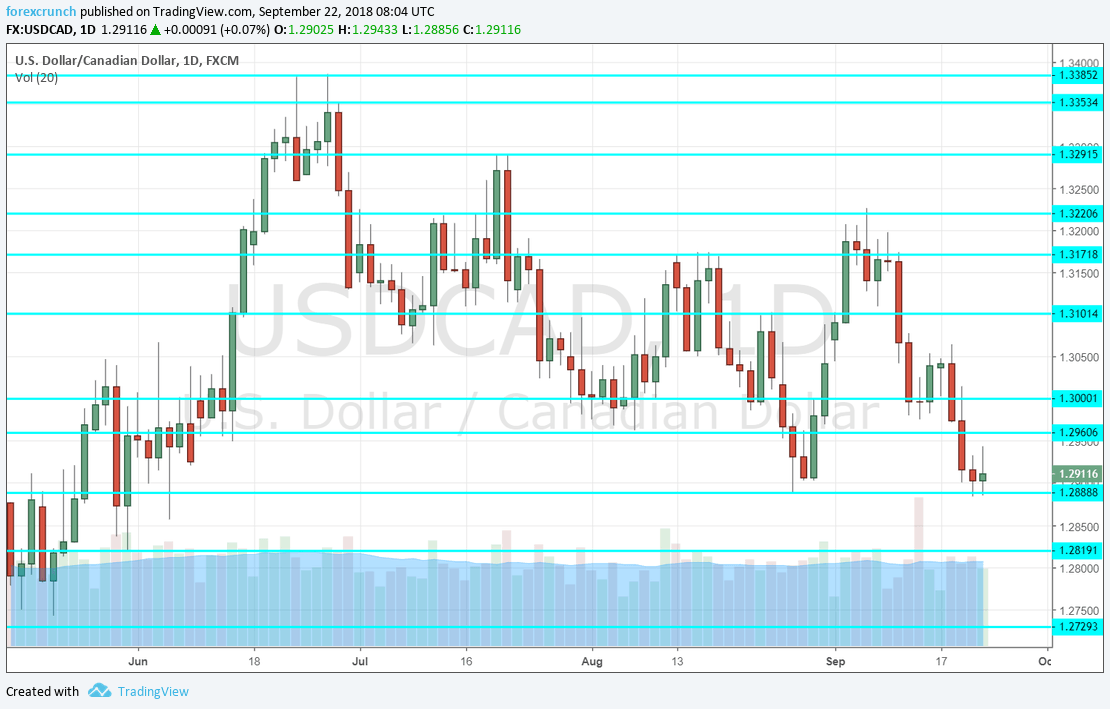
[do action=”autoupdate” tag=”EURUSDUpdate”/]USD/CAD daily chart with support and resistance lines on it. Click to enlarge:
- Wholesale Sales: Monday, 12:30. Sales at the wholesale level give an indication of sales at the retail level. Sales dropped by 0.8% in June and we will now get the figures for July, which will likely see a bounce in this Canadian sector.
- Canadian GDP: Friday, 12:30. Canada releases its monthly GDP read for July, the first look into Q3. June’s figure disappointed by remaining flat, but Q2 was quite positive in general, a comeback quarter after a weak Q1. An increase of 0.1% m/m is on the cards now.
- RMPI: Friday, 12:30. Alongside monthly GDP, Canada publishes the Raw Materials Price Index, which provides some insights into inflation. A surprising increase of 0.7% was seen in July. The figure for August may be more modest.
*All times are GMT
USD/CAD Technical Analysis
Dollar/CAD kicked off the week with a dip below 1.30 (mentioned last week).
Technical lines from top to bottom:
1.3295 held the pair down in mid-July. 1.3220 capped it earlier in the month.
1.3170 served as resistance in mid-August. 1.3100 is a round number that also capped the pair several times in August.
1.3045 separated ranges in mid-September and is a pivotal line. Below 1.3000 we find the mid-August trough of 1.2960. 1.2890 is the initial low seen in late August.
1.2820 was a stepping stone on the way up in late May. 1.2730 provided support earlier in May. Lower, 1.2630 held the pair down back in April.
I am neutral on USD/CAD
Data has been mixed and the impact of the tariffs has been mixed as well. The movement depends on GDP but also on NAFTA headlines which are hard to predict given Trump’s erratic nature.
Our latest podcast is titled Too hot or too cold? The world is watching the Fed
Follow us on Sticher or iTunes
Further reading:
- EUR/USD forecast – for everything related to the euro.
- GBP/USD forecast – Pound/dollar predictions
- USD/JPY forecast – analysis for dollar/yen
- AUD/USD forecast – projections for the Aussie dollar.
- Forex weekly forecast – Outlook for the major events of the week.
Safe trading!
