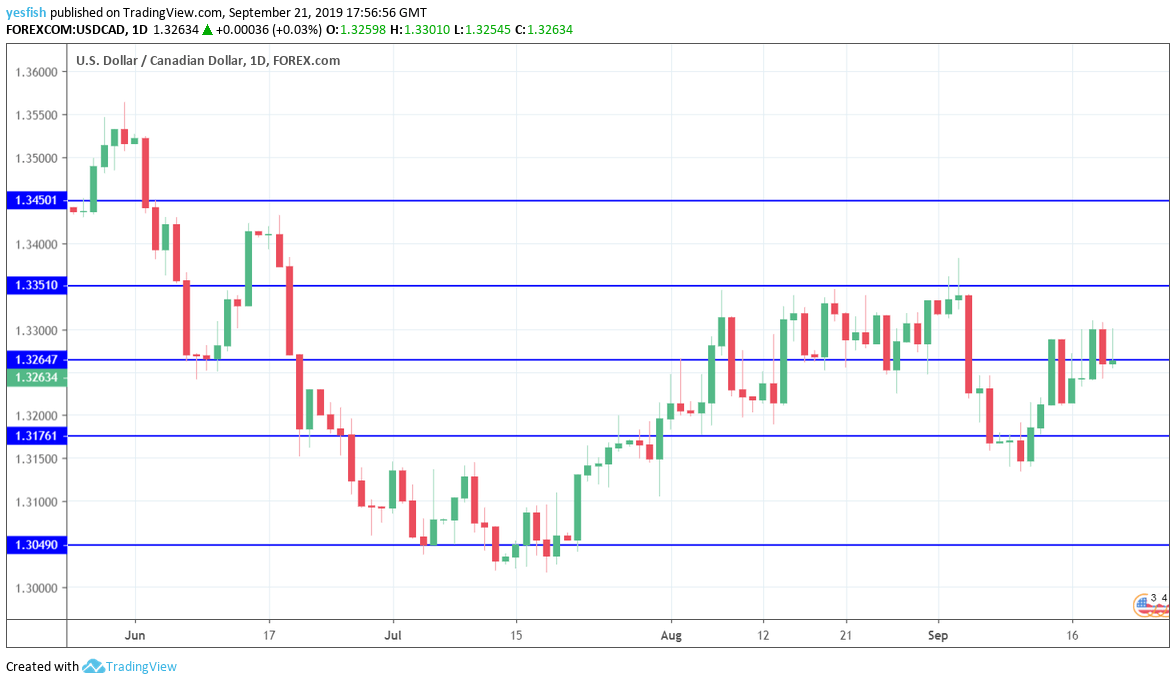
USD/CAD daily chart with support and resistance lines on it. Click to enlarge:
It was another quiet week for the Canadian dollar, as USD/CAD posted slight gains. With just one Canadian event on the schedule, U.S. releases will have a magnified effect on the direction of the pair. Investors will be keep a close eye on Final U.S. GDP for Q2. Here is an outlook at the highlights and an updated technical analysis for USD/CAD.
In Canada, consumer inflation disappointed in July, as CPI fell by 0.1%, compared to a gain of 0.5% in the June release. Core CPI also declined by 0.1%. Oil prices soared early in the week in response to an attack on a Saudi oil refinery, but the Canadian dollar did not show much reaction.
In the U.S., the Federal Reserve cut rates by a 1/4 point, the second rate cut in less than two months. The move did not weigh on the U.S. dollar, as Fed Chair Powell sounded hawkish, saying that the U.S economy was in strong shape and that the rate cut was an insurance policy in case the economic picture deteriorated.
- Wholesale Sales: Monday, 12:30. Wholesale Sales have been quite erratic, resulting in estimates that are often well off the mark. In June, the indicator gained 0.6%, well above the estimate of -0.2%. The markets are expecting a drop to zero in July.
USD/CAD Technical Analysis
Technical lines from top to bottom:
We start with resistance at 1.3630. 1.3565 is next.
1.3445 has held in resistance since the first week of June. This is followed by 1.3385.
1.3350 is the next resistance line.
1.3265 was active throughout the week. USD/CAD ended the week just below this line.
1.3175 is providing support.
1.3125 (mentioned last week) is next. It has provided support since the end of July.
1.3048 is protecting the round number of 1.3000, which has psychological significance.
1.2916 has held firm since October.
1.2830 is the final support line for now.
I remain bullish on USD/CAD
The surge in oil prices this week is indicative of rising tensions in the Persian Gulf, and any further ominous developments could quickly dampen risk appetite and hurt minor currencies like the Canadian dollar.
Further reading:
- EUR/USD forecast – for everything related to the euro.
- GBP/USD forecast – Pound/dollar predictions
- USD/JPY forecast – analysis for dollar/yen
- AUD/USD forecast – projections for the Aussie dollar.
- Forex+ weekly forecast – Outlook for the major events of the week.
Safe trading!
