- US two-year Treasury rates climbed to a nearly one-month high of 4.231%.
- Fed’s James Bullard said he leans toward adding 75 basis points of tightening.
- The annual inflation rate in Canada decreased to 4.3% in March from 5.2% in February.
Today’s USD/CAD price analysis is bullish. The dollar recovered on Wednesday after swinging back and forth with bond market volatility. Investors looked for clues about the direction of interest rates in US economic statistics, Federal Reserve remarks, and corporate earnings.
–Are you interested to learn more about Forex demo accounts? Check our detailed guide-
US two-year Treasury rates, highly sensitive to Fed predictions, climbed to a nearly one-month high of 4.231% overnight and stayed at this level during Wednesday’s trade in Tokyo.
James Bullard, the head of the St. Louis Fed, said in an interview with Reuters that he leans toward adding 75 basis points of tightening.
On Tuesday, the Canadian dollar hardly moved in relation to its American counterpart as investors noted that, as expected, Canada’s inflation dropped to its lowest level in 19 months.
The annual inflation rate in Canada decreased to 4.3% in March from 5.2% in February, which was in line with predictions. Reducing energy prices helped balance a record-high increase in mortgage expenses.
There isn’t much reason for the market to alter its predictions for what the Bank of Canada will do this year because almost all the numbers met forecasts.
Money market data indicated that the Canadian central bank would maintain its policy rate at 4.50% for the remainder of 2023.
USD/CAD key events today
USD/CAD investors will pay attention to the crude oil inventories report from the US. This report will affect oil prices which will, in turn, affect the Canadian dollar.
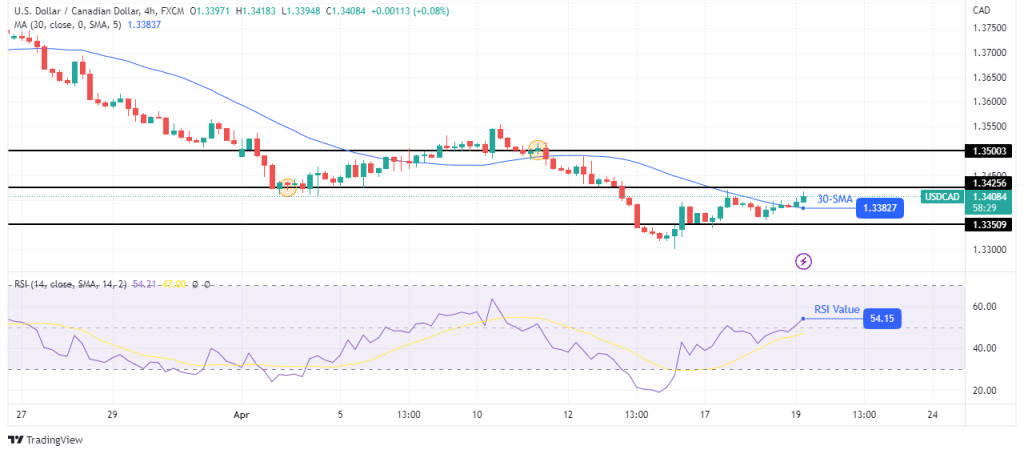
USD/CAD technical price analysis: Indecision at the 30-SMA

In the 4-hour chart, bulls are challenging bears at the 30-SMA resistance. The price has crossed above the SMA, a sign that bulls are in the lead. This can also be seen in the RSI, which has crossed above 50. However, the bulls must make a stronger candle pushing off the SMA to confirm the break.
–Are you interested to learn more about South African forex brokers? Check our detailed guide-
Currently, the price is making small-bodied candles which points to indecision. One side will soon decide to take the lead. If bulls win, the price will retest resistance at 1.3425 and 1.3500. On the other hand, if bears retake control, the price will take out the 1.3350 support.
Looking to trade forex now? Invest at eToro!
68% of retail investor accounts lose money when trading CFDs with this provider. You should consider whether you can afford to take the high risk of losing your money.
