- Rising Treasury yield and a bullish dollar are pushing USD/CAD higher.
- A possible increase in oil production has seen oil prices drop, pushing USD/CAD up.
- Investors expect crude oil inventories to drop in the US.
Thursday morning saw the USD/CAD price continue its Wednesday gains pushed by the stronger dollar. The dollar was boosted by upbeat manufacturing data and rising Treasury yields.
-Are you interested in learning about forex indicators? Click here for details-
The Canadian dollar, which is quite sensitive to oil prices, was weakened as oil prices slumped. This drop in oil prices came after a report from the Financial Times said that Saudi Arabia might raise oil production in the event of a significant decrease in Russian output.
Matt Simpson, a senior market analyst at City Index in Sydney, said Western leaders would welcome the news, given inflation remains sky-high and hiking rates are pushing their economies into a recession. More oil supply will cool some of this inflation. This news pushed oil lower as saw USD/CAD pushed higher.
USD/CAD key events today
Later in the day, investors will be looking out for the US’s ADP Nonfarm Employment Change data. Investors expect an increase from 247K to 300K. This data is a good indicator of the nonfarm payroll report coming out on Friday, and a higher-than-expected reading could push USD/CAD up. Investors expect the initial jobless claims in the US to hold at 210K.
Finally, investors will pay close attention to the crude oil inventory data from the US, which they expect to drop from -1.019M to -1.350M. A more considerable drop would be bullish for crude prices and strengthen the Canadian dollar against the US dollar pushing USD/CAD lower. The reverse is true.
USD/CAD price technical analysis: RSI bullish divergence pushing to 1.2800
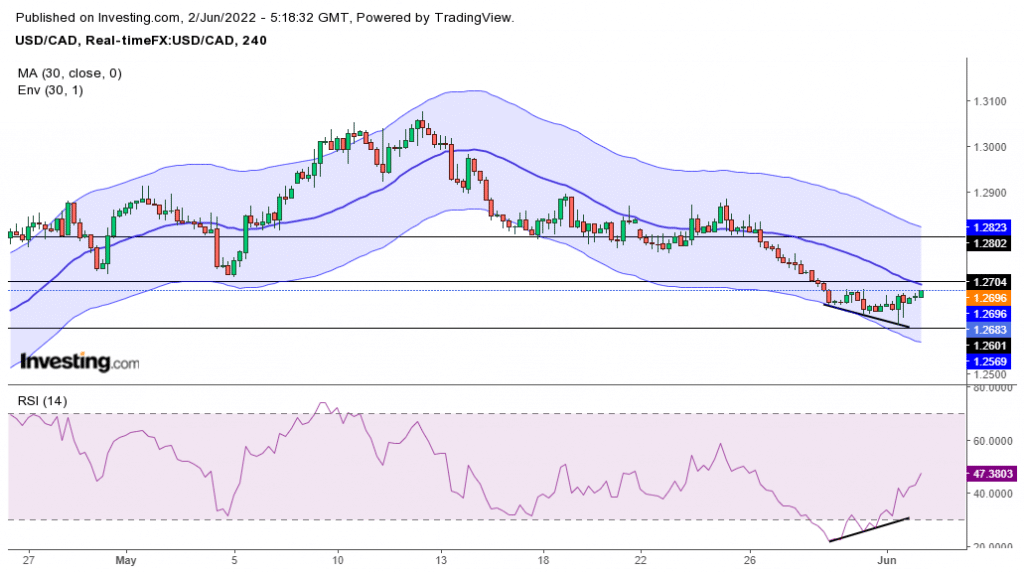
The 4-hour chart shows the price trading below the 30-SMA. The price is caught between 1.2700 and 1.2600. RSI is showing weakness in bearish momentum in the oversold region, which could mean the return of bullish momentum. This bullish momentum could lead to a pullback or a reversal.
-Are you interested in learning about the forex signals telegram group? Click here for details-
A pullback could mean seeing the price break the 30-SMA and hit 1.2800 before the downtrend resumes. On the other hand, a reversal would happen if the price started trading above the 30-SMA with the RSI getting overbought. The bias here is, therefore, still down.
Looking to trade forex now? Invest at eToro!
68% of retail investor accounts lose money when trading CFDs with this provider. You should consider whether you can afford to take the high risk of losing your money
