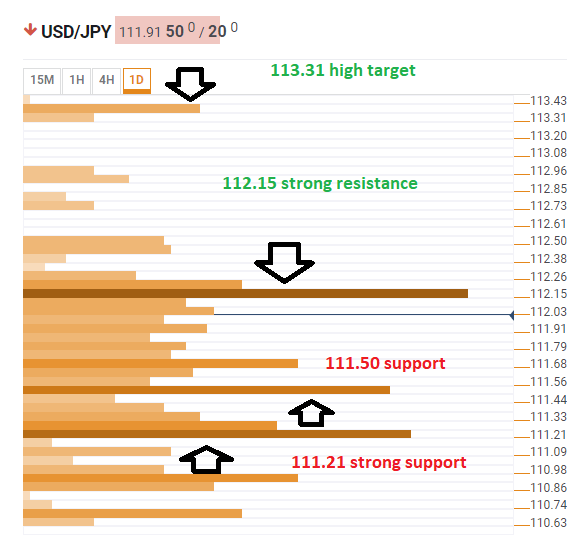
USD/JPY has been crawling upwards amid a better market mood. Reports about progress in US-Chinese trade talks helped. How far can it go? The pair faces tough resistance now.
The Technical Confluences Indicator shows that USD/JPY is capped at 112.15 where it faces a dense cluster of lines including the Pivot Point one-month Resistance 1, the previous one-day high, the previous monthly high, the Bollinger Band one-day Upper, the Simple Moving Average 10-1h, the Fibonacci 23.6% one-day, and more.
If it manages to break higher, the next cap is 113.31, where the Pivot Point one-month awaits it.
Looking down, support awaits at 111.50 which is the convergence of the SMA 5-1d, the SMA 200-1h, the SMA 10-1d, the SMA 50-4h, and the BB 4h-Middle.
The most significant support line is at 111.21 which is the confluence of the PP 1d-S3, the PP 1w-S1, the Fibonacci 61.8% one-month, and the SMA 200-4h.
Here is how it looks on the tool:
Confluence Detector
The Confluence Detector finds exciting opportunities using Technical Confluences. The TC is a tool to locate and point out those price levels where there is a congestion of indicators, moving averages, Fibonacci levels, Pivot Points, etc. Knowing where these congestion points are located is very useful for the trader, and can be used as a basis for different strategies.
This tool assigns a certain amount of “weight” to each indicator, and this “weight” can influence adjacents price levels. These weightings mean that one price level without any indicator or moving average but under the influence of two “strongly weighted” levels accumulate more resistance than their neighbors. In these cases, the tool signals resistance in apparently empty areas.
