The Canadian dollar slumped and lost 200 points, as USD/CAD closed at 1.3330. This week’s highlights are CPI, retail sales and GDP. Here is an outlook on the major market-movers and an updated technical analysis for USD/CAD.
It was a busy week in the currency markets, courtesy of the Federal Reserve. The Fed raised rates a quarter point to 0.50%, just the second rate hike since the financial crisis in 2008. The Fed was hawkish in its rate statement and upgraded its hike forecast for 2017. This triggered a US dollar rally and the Canadian currency posted sharp losses. Elsewhere, US retail sales missed expectations, while US CPI came in at 0.2%, matching the forecast. Canadian Manufacturing Sales was dismal at -0.8%, well below expectations.
Updates:
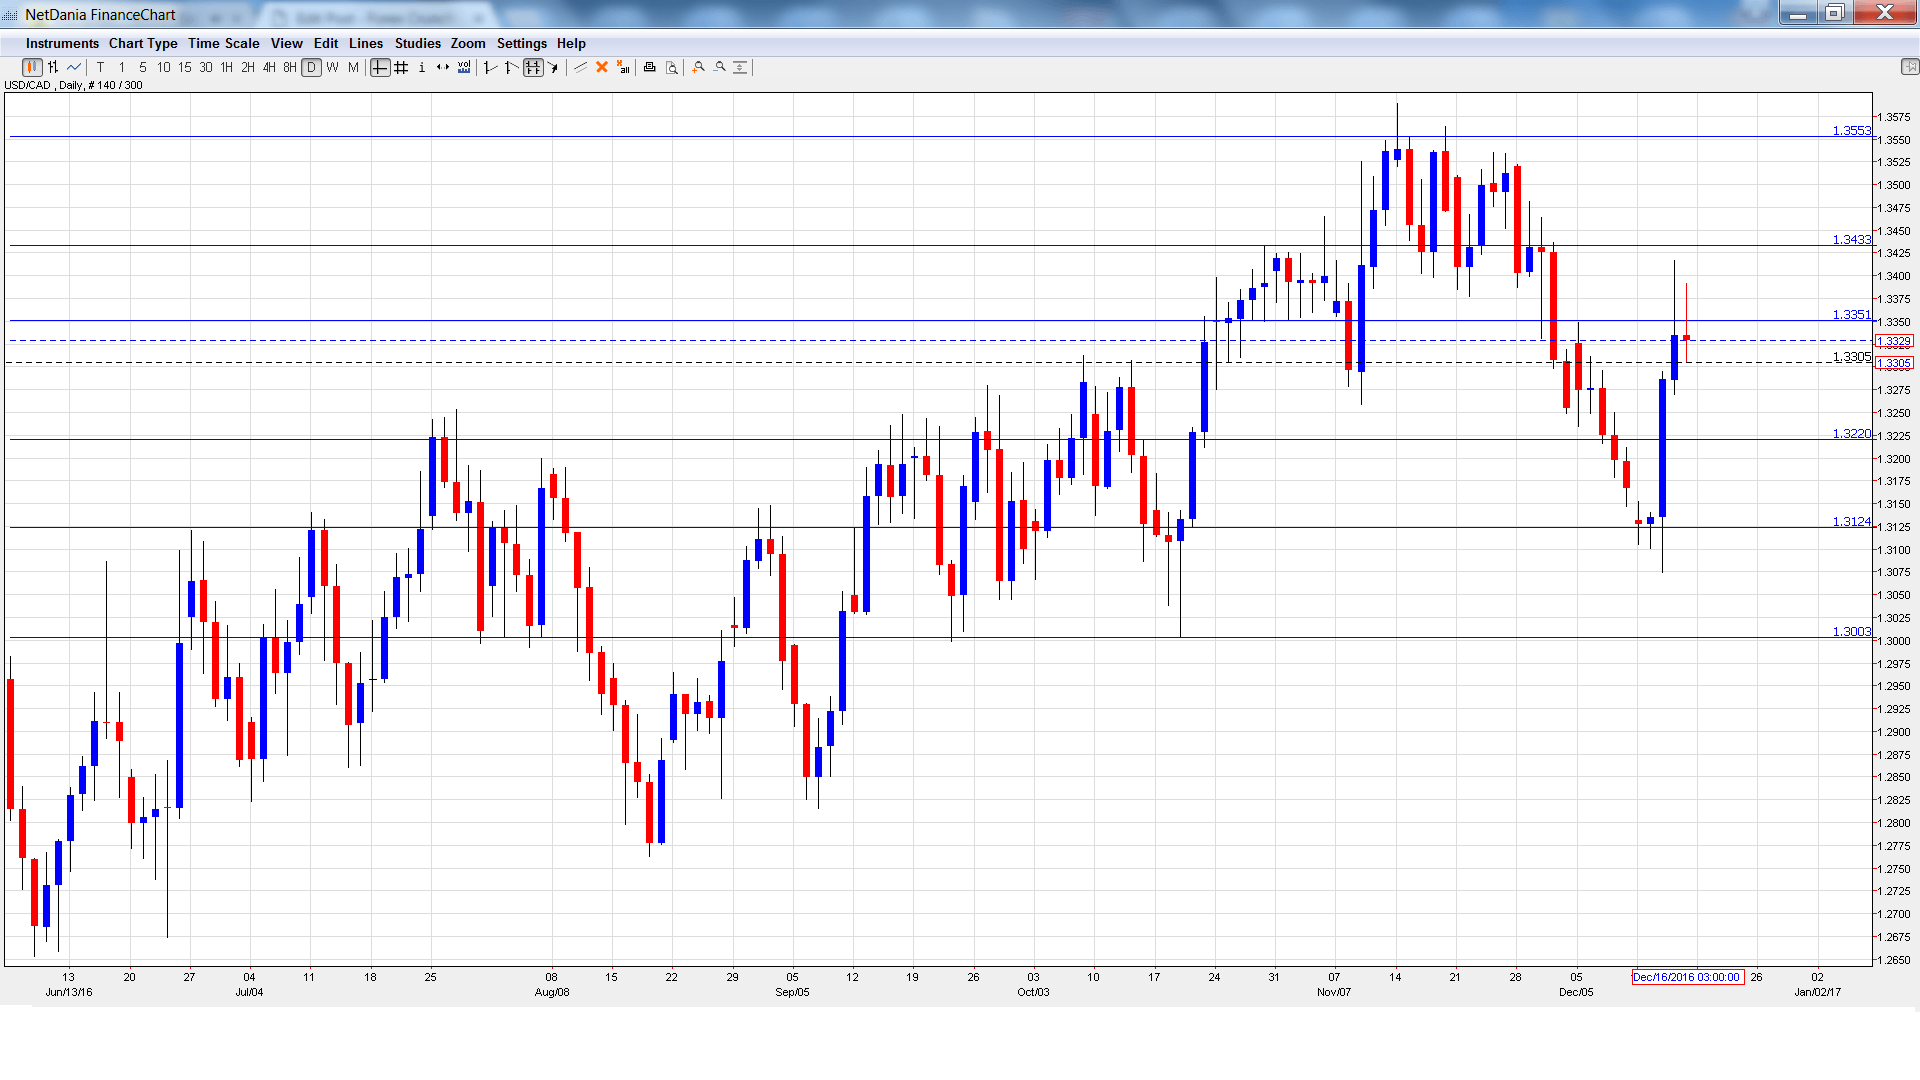
USD/CAD daily graph with support and resistance lines on it. Click to enlarge:
- Wholesale Sales: Tuesday, 13:30. The indicator slipped 1.2% in September, well off the forecast of 0.3%. The estimate for the October report stands at 0.3%.
- Core CPI: Thursday, 13:30. This is the first key event of the week. Inflation levels remain weak, as the index has recorded two straight gains of 0.2%,
- Core Retail Sales: Thursday, 13:30. The indicator has been struggling, with no gains since May. The September reading was a flat 0.0%, well off the forecast of 0.6%. The markets are expecting a strong turnaround, with an estimate of a 0.7% gain.
- CPI: Thursday, 13:30. CPI posted improved to 0.2% in October, matching the forecast. The estimate for the November report stands at -0.1%.
- Retail Sales: Thursday, 13:30. Retail Sales improved to 0.6% in September, after three straight readings of -0.1%. A small gain of 0.1% is forecast for October.
- GDP: Friday, 13:30. Canada releases GDP released every month. The September report edged up to 0.3% in October, above the estimate of 0.1%. The forecast for November remains steady at 0.1%.
USD/CAD opened the week at 1.3131 and dropped to a low of 1.3074. The pair then reversed directions and climbed sharply to a high of 1.3417, as resistance held firm at 1.3433 (discussed last week). USD/CAD was unable to consolidate at these levels and closed the week at 1.3329.
Live chart of USD/CAD:
Technical lines, from top to bottom
We start with resistance at 1.3648.
1.3551 is next.
1.3433 was the high point in October.
1.3351 is a weak resistance line. It could see action early next week.
1.3219 is an immediate support level.
1.3124 is next.
1.3003 is protecting the symbolic 1.30 level. It was last tested in mid-October.
1.2922 is the final support line for now.
I am bearish on USD/CAD
The Canadian dollar has piggybacked on stronger oil prices, but the oil rally may be over for now. The US dollar could make further headway in the aftermath of the US rate hike. Economic sentiment remains high ahead of Donald Trump taking over in Washington, which could be bullish for the greenback.
Our latest podcast is titled The FED and the Road Ahead
Follow us on Sticher or iTunes
Safe trading!
Further reading:
- For EUR/USD, check out the Euro to Dollar forecast.
- For the Japanese yen, read the USD/JPY forecast.
- For GBP/USD (cable), look into the British Pound forecast.
- For the Australian dollar (Aussie), check out the AUD to USD forecast.
- For the kiwi, see the NZDUSD forecast.
