The Canadian dollar continued its sharp descent, losing close to 300 points last week. USD/CAD has now gained a remarkable 11 cents in the month of January. This week’s highlights are Building Permits and Employment Change. Here is an outlook on the major market-movers and an updated technical analysis for USD/CAD.
It was another week to forget for the shaky Canadian dollar. The currency posted sharp losses after the Federal Reserve statement, which noted solid US growth. This trend continued as US Unemployment Claims sparkled and Canadian GDP contracted in November.
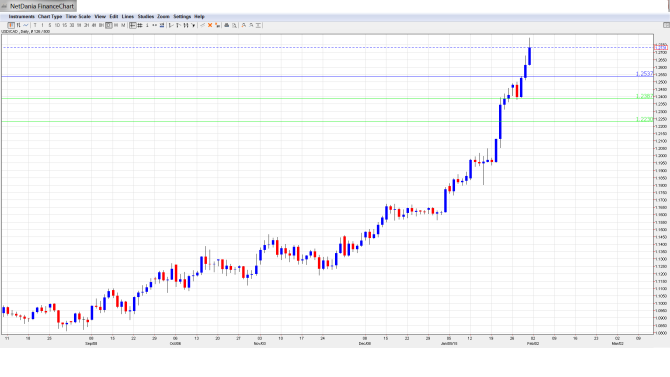
[do action=”autoupdate” tag=”USDCADUpdate”/]USD/CAD daily chart with support and resistance lines on it. Click to enlarge:
- RMPI: Tuesday, 13:30. The Raw Materials Price Index is an important gauge of manufacturing inflation. The index continues to decline and posted a reading of -5.8% in December. Another decline is expected in the January release, with the estimate standing at -4.6%.
- Ivey PMI: Wednesday, 15:00. The PMI has hovered in the mid-50s for the past two months, indicative of solid expansion. Little change is anticipated in the upcoming release, with an estimate of 55.9 points.
- Trade Balance: Thursday, 13:30. Trade Balance is closely linked to currency demand, as foreigners must buy Canadian dollars in order to purchase Canadian goods and services. Canada posted a trade deficit in December of C$-0.6 billion, and a deficit of $1.0 billion is expected for the January report.
- Building Permits: Friday, 13:30. Building Permits tends to fluctuate, making accurate estimates a tricky task. This was the case in the December report, as the indicator posted a sharp decline of 13.8%. The estimate stood at 0.8%. The markets are expecting a strong turnaround in the upcoming release, with an estimate of 4.5%.
- Employment Data: Friday, 13:30. This is one of the most important indicators and should be treated as a market-mover. The indicator has posted two straight declines, both of which were well off the estimates. The markets are anticipating better news for January, with an estimate of 5.1 thousand. Will the indicator beat the prediction? The unemployment rate has been pegged at 6.6% for the past two readings and is expected to nudge higher to 6.7% in the January report.
* All times are GMT
USD/CAD Technical Analysis
USD/CAD opened the week at 1.2459 and touched a low of 1.2379. The pair then sharply reversed directions and almost touched the 1.28 line, hitting a high of 1.2798. USD/CAD closed the week at the 1.2731, breaking past resistance at 1.2711 (discussed last week).
Live chart of USD/CAD:
[do action=”tradingviews” pair=”USDCAD” interval=”60″/]Technical lines, from top to bottom:
With the Canadian dollar continuing to post sharp losses, we start at higher levels:
1.3063 has been a resistance line since March 2009.
1.2924 was an important support line back in November 2003.
1.2711 has switched to a support role following strong gains by USD/CAD. This line had been a cap since June 2005.
1.2541 is providing strong support.
1.2387 was an important cap back in May 2005.
1.2230 is the final support level for now.
I am bullish on USD/CAD
The Canadian dollar can’t find its footing in 2015, and we could see the currency continue to lose ground. Much will depend on this week’s employment numbers, which will have to be strong to upright the leaky loonie. Market sentiment remains positive over the US economy, despite a disappointing Advance GDP for Q4.
In our latest podcast, we do a Fed rundown analyze the Greek elections and discuss the suffering Aussie:
Further reading:
- For a broad view of all the week’s major events worldwide, read the USD outlook.
- For EUR/USD, check out the Euro to Dollar forecast.
- For the Japanese yen, read the USD/JPY forecast.
- For GBP/USD (cable), look into the British Pound forecast.
- For the Australian dollar (Aussie), check out the AUD to USD forecast.
- For the kiwi, see the NZDUSD forecast.
