The Canadian dollar posted weekly gains for the first time in three weeks, as USD/CAD closed slightly below the 1.12 line. This week’s highlights are Manufacturing Sales and Core CPI. Here is an outlook on the major market-movers and an updated technical analysis for USD/CAD.
Canadian job data was outstanding, as Employment Claims jumped to their highest level in over a year. However, the falling price of oil hurt the Canadian dollar. In the US, the dollar softened after unexpectedly dovish FOMC minutes, where the central bank expressed concern about the recent strength of the dollar against its major rivals.
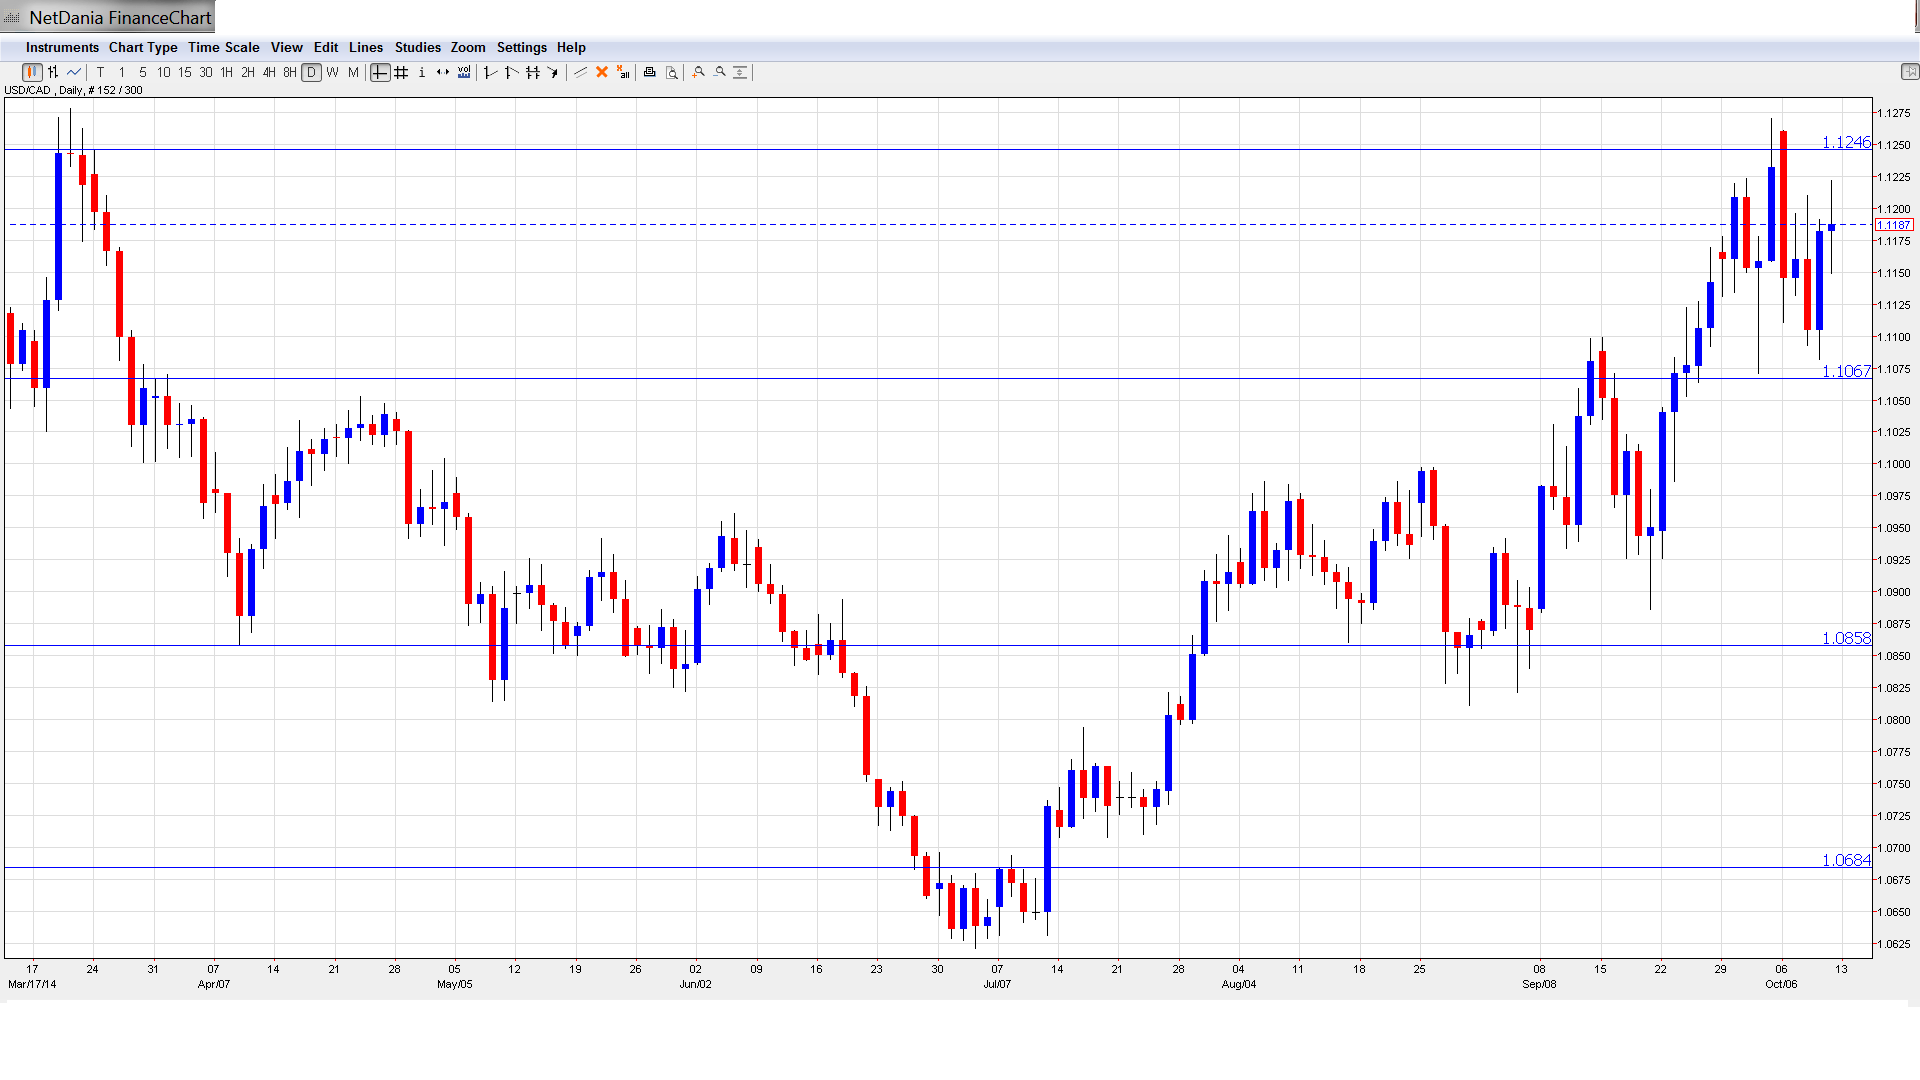
[do action=”autoupdate” tag=”USDCADUpdate”/]USD/CAD daily chart with support and resistance lines on it. Click to enlarge:
- Manufacturing Sales: Thursday, 12:30. Manufacturing Sales, a key event, can affect the direction of USD/CAD. The indicator has posted three straight gains, and posted a strong reading of 2.5% in August. This easily beat the estimate of 1.1%. However, the markets are bracing for a strong downturn in the upcoming release, with the estimate standing at -1.6%.
- Foreign Securities Purchases: Thursday, 12:30. This indicator is directly linked to currency demand, as foreigners must purchase Canadian dollars in order to buy Canadian securities. The indicator has posted three gains in the past four releases, and the markets are expecting another gain in the September release, with a forecast of 4.31 C$.
- Core CPI: Friday, 12:30. Core CPI is the primary gauge of consumer inflation. The most volatile items which make up CPI are removed from Core CPI, providing a more accurate indication of consumer inflation. The indicator posted a gain of 0.5% in August, ahead of the estimate of 0.2%. The estimate for the upcoming release stands at 0.1%.
- CPI: Thursday, 12:30. CPI continues to hover at low levels and posted a flat reading of 0.0%. This edged above the estimate of -0.1%. The markets are expecting the indicator to remain at 0.0% in the September reading.
* All times are GMT.
USD/CAD Technical Analysis
USD/CAD opened the week at 1.1260, touching a high of 112.61, as resistance at 112.78 (discussed last week) held firm. The pair touched a low of 1.1082 but then recovered, closing the week at 1.1187.
Live chart of USD/CAD: [do action=”tradingviews” pair=”USDCAD” interval=”60″/]
Technical lines, from top to bottom:
1.1640 has provided resistance since June 2009. This marked the start of a US dollar rally which saw the pair drop close to the 0.94 line.
1.1494 was a key resistance line in November 2006.
1.1369 was breached in October 2008 as the US dollar posted sharp gains, climbing as high as the 1.21 level. This line has remained steady since July 2009.
1.1278 held firm for the second straight week, and has some breathing room as USD/CAD trades at lower levels.
1.1122 was briefly breached but recovered on Friday. It starts off the week as immediate support.
1.1054 remains a strong support line. 1.0944 is next.
1.0815 has held firm since late August.
1.0737 marked a cap in mid-2010, before the US dollar tumbled and dropped all the way into 0.93 territory. It is the final support line for now.
I remain bullish on USD/CAD
The US dollar had an off week after the FOMC minutes, but economic fundamentals remain strong. With QE winding up and market focus shifting to an interest rate hike, the greenback could flex some muscle and resume its upward movement.
In our latest podcast, we talk about the US labor market, run down the FOMC minutes, reflect on falling oil and discuss next week’s events:
Subscribe to our podcast on iTunes.
Further reading:
- For a broad view of all the week’s major events worldwide, read the USD outlook.
- For EUR/USD, check out the Euro to Dollar forecast.
- For the Japanese yen, read the USD/JPY forecast.
- For GBP/USD (cable), look into the British Pound forecast.
- For the Australian dollar (Aussie), check out the AUD to USD forecast.
- USD/CAD (loonie), check out the Canadian dollar.
