The Canadian dollar dropped sharply last week, surrendering about 200 cents against the US dollar. USD/CAD closed the week at 1.1142, its lowest level since March. This week’s highlight is GDP. Here is an outlook on the major market-movers and an updated technical analysis for USD/CAD.
Canadian Core Retail Sales disappointed, posted its first decline since January. The US economy continued to post strong numbers, as New Home Sales beat the estimate and GDP sparkled with a 4.6% gain in Q2.
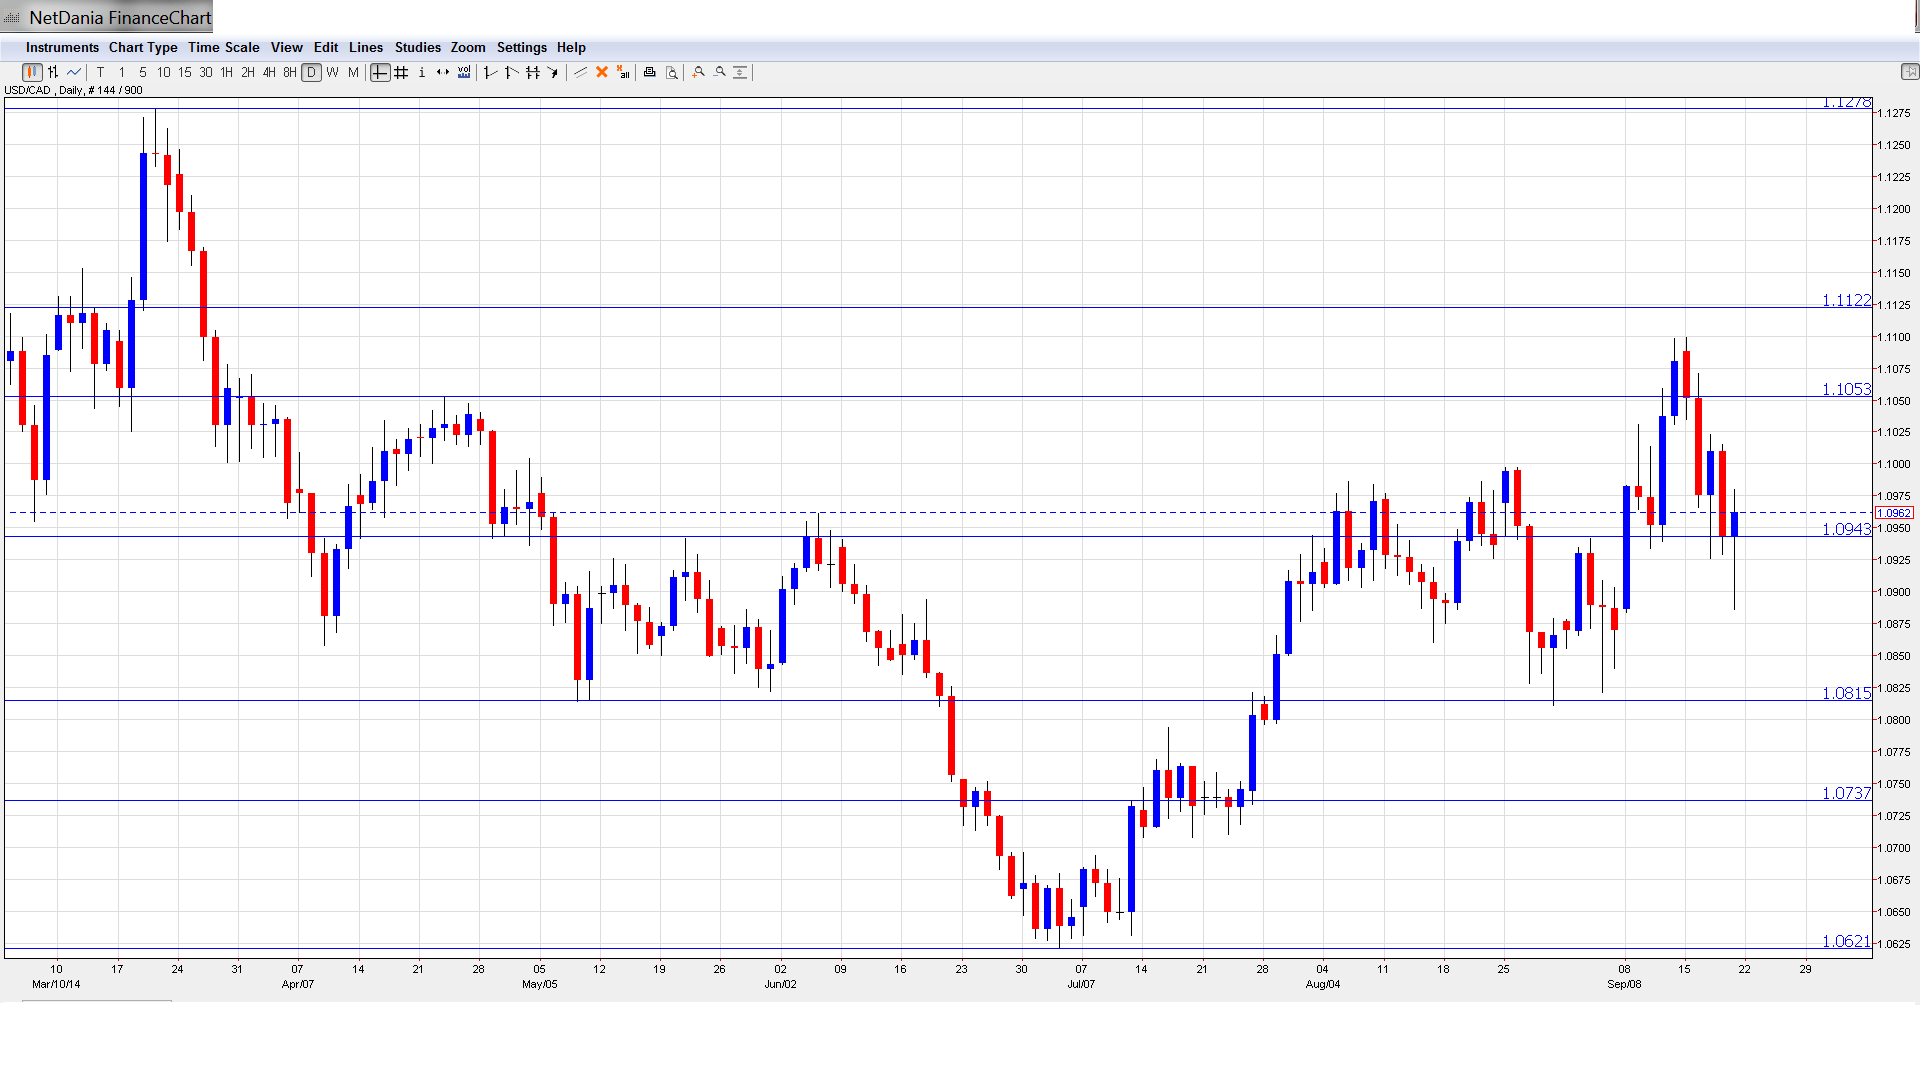
[do action=”autoupdate” tag=”USDCADUpdate”/]USD/CAD daily chart with support and resistance lines on it. Click to enlarge:
- GDP: Tuesday, 12:30. GDP, which measures the change in economic output. is one of the most important indicators. The Canadian indicator is released every month, unlike the US and other major economies, which release GDP on a quarterly basis. The indicator posted a gain of 0.3%, edging above the estimate of 0.2%. The forecast for the upcoming release stands at 0.2%.
- Raw Materials Price Index: Tuesday, 12:30. RMPI has been alternating between gains and declines in recent releases. The index posted a sharp decline of 1.4%, its sharpest drop in 2014. Another weak reading is expected in the August release, with an estimate of -1.7%.
- Trade Balance: Friday, 12:30. Trade Balance is directly linked to currency demand, as foreigners need to buy Canadian dollars to purchase Canadian exports. The indicator has moved higher over the past three months and posted a surplus of 2.6 billion $C in August. This easily beat the estimate of 1.1 billion $C. The surplus is expected to drop to 1.5 billion $C in the upcoming reading.
* All times are GMT.
USD/CAD Technical Analysis
USD/CAD opened the week at 1.0947. The pair touched a low of 1.0926 and then climbed all the way to 1.1169, breaking above resistance at 1.1122 (discussed last week). The pair closed the week at 1.1142.
Live chart of USD/CAD: [do action=”tradingviews” pair=”USDCAD” interval=”60″/]
Technical lines, from top to bottom:
With USD/CAD posting strong gains, we begin at higher levels:
1.1640 provided has provided resistance since June 2009. This marked the start of a US dollar rally which saw the pair drop close to the 0.94 line.
1.1494 was a key resistance line in November 2006.
1.1369 was breached in October 2008 as the US dollar posted sharp gains, climbing as high as the 1.21 level. This line has remained steady since July 2009.
1.1278 has provided resistance since March. This line marked the start of a rally by the Canadian dollar, which dropped below the 1.09 level.
1.1122 was breached and has switched to a support role. It is a weak line and could see action early in the week.
1.1054 continues to provide support. 1.0944 is the next line of support.
1.0815 has held firm since late August.
1.0737 marked a cap in mid-2010, before the US dollar tumbled and dropped all the way into 0.93 territory.
1.0621 marked a low point for the pair in early July. It is the final support line for now.
I am bullish on USD/CAD
The US dollar posted broad gains last week, and the Canadian dollar was flattened by the greenback juggernaut. US numbers have looked solid, and the markets are expecting a strong NFP late in the week. With the Fed set to wean the economy off QE in October, there will be more focus on the timing of an interest rate hike.
In our latest episode, we talk about Contango vs. Backwardation, Scottish reverberations and key US data:
Subscribe to our podcast on iTunes.
Further reading:
- For a broad view of all the week’s major events worldwide, read the USD outlook.
- For EUR/USD, check out the Euro to Dollar forecast.
- For the Japanese yen, read the USD/JPY forecast.
- For GBP/USD (cable), look into the British Pound forecast.
- For the Australian dollar (Aussie), check out the AUD to USD forecast.
- USD/CAD (loonie), check out the Canadian dollar.
