USD/CAD was almost unchanged at the end of the week, closing at 1.0333. This week’s major releases are Core Retail Sales and Core CPI. Here is an outlook on the major market-movers and an updated technical analysis for USD/CAD.
Canadian Manufacturing Production, a key release, was a big disappointment, posting its third decline in four months. In the US, Employment Claims looked sharp, but manufacturing numbers were not and the week ended on a sour note as consumer sentiment data slumped.
[do action=”autoupdate” tag=”USDCADUpdate”/]USD/CAD daily chart with support and resistance lines on it. Click to enlarge: 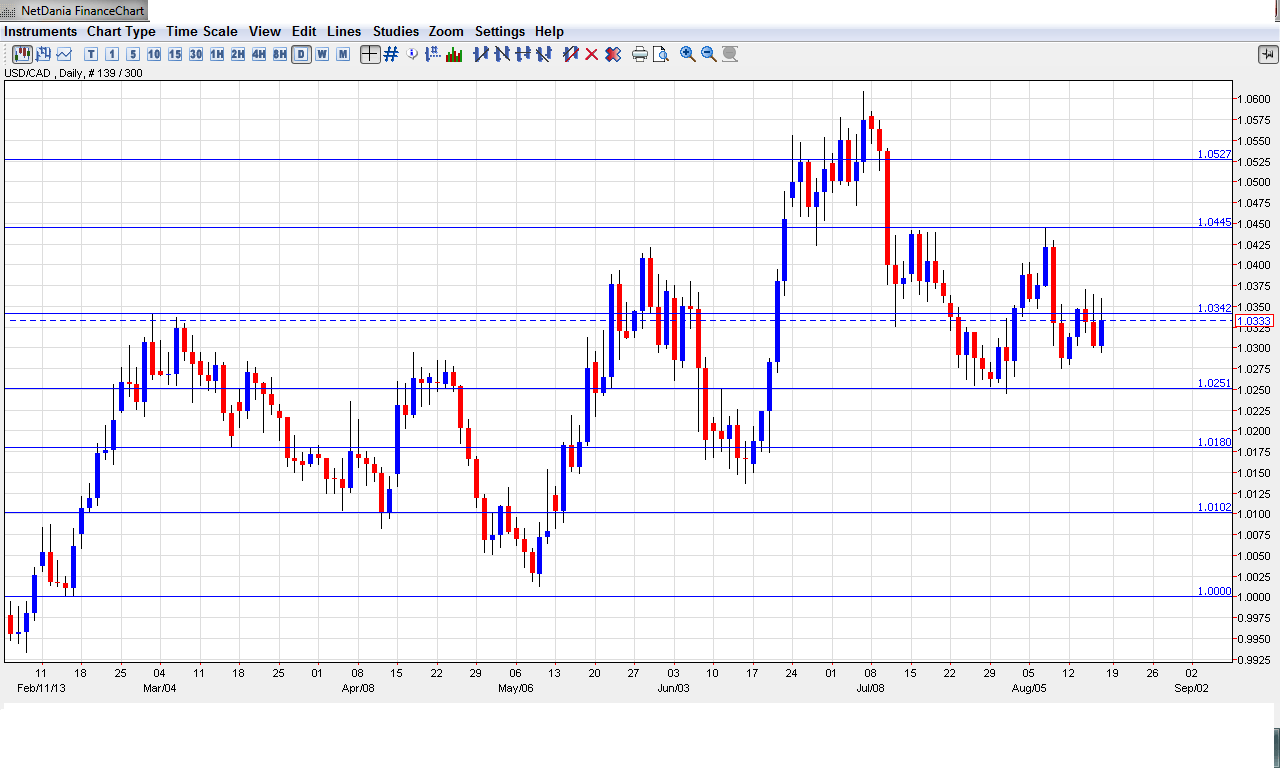
- Wholesale Sales: Tuesday, 12:30. Wholesale Sales is an important indicator of consumer spending. The indicator has been posting modest gains in recent releases, but surprised the markets in July with an outstanding gain of 2.3%. This crushed the estimate of 0.4%. The markets are bracing for a weak reading in August, with the estimate standing at -0.5%.
- Core Retail Sales: Thursday, 12:30. This key consumer spending release posted a gain of 1.2% in July, way above the estimate of 0.1%. The markets are expecting a weak release in August, with an estimate of a paltry 0.1% gain. Will the indicator surprise the markets and repeat with another strong reading?
- Retail Sales: Thursday, 12:30. Retail Sales posted its sharpest gain in over three years last month, jumping 1.9%. However, the markets are anticipating a sharp downturn in the upcoming release, with a estimate of -0.3%. If the indicator does drop into negative territory, it would be the first decline since February.
- CPI: Friday, 12:30. CPI is considered one of the most important inflation indicators and can have a major impact on the movement of USD/CAD. The previous release dropped to a flat reading of 0.0%, short of the estimate of 0.2%. Will the index push back into positive territory in the August release?
- Core CPI: Friday, 12:30. Core CPI is considered a more reliable indicator of inflation than CPI, since it excludes the most volatile items found in CPI. Core CPI declined 0.2% in July. Although this matched the forecast, the weak reading is a reason for concern as this was the first decline since January. If this major index posts another decline, the Canadian dollar could lose ground.
- Jackson Hole Symposium: Thursday-Saturday. The Jackson Hole Symposium in Wyoming is an important economic conference attended by central bankers, finance ministers, financial market participants and academics from around the world. With speculation that the Fed could taper QE as early as September, the conference could be prove to be a market-mover and will be carefully monitored by analysts.
* All times are GMT.
USD/CAD Technical Analysis
USD/CAD opened the week at 1.0313 and climbed to a high of 1.0370. The pair then dropped below the 1.03 line, touching a low of 1.0294. USD/CAD then pushed back above the 1.03 line, closing the week at 1.0333, as the resistance line of 1.0340 (discussed last week) held firm.
Live chart of USD/CAD:
[do action=”tradingviews” pair=”USDCAD” interval=”60″/]
Technical lines, from top to bottom:
We start with resistance at 1.0853. This line has remained intact since September 2009.
1.0705 saw a lot of action in January 2010, but has quietly provided strong resistance since that time. 1.0652 has been providing resistance since early September 2010.
1.0523 was a peak back in November 2011. It has provided strong resistance since July.
1.0446 was a cap in mid-July. It was tested during the week as USD/CAD moved higher early in the week. With the pair dropping below the 1.03 level, this line has some breathing room.
1.0340 saw some action this week as USD/CAD lost ground and dropped below the 1.03 line before recovering. The pair closed just below this line, which could be tested early next week.
USD/CAD is receiving support at 1.0250. This line worked as support quite well in July. Currently, it is not a strong line and could face pressure if the loonie shows some strength.
1.0180 provided support for the pair during March, and saw a lot of activity in the first half of June. The round number of 1.01 was a trough back in July 2012 and switched to resistance afterwards. The line proved its strength several times in 2013, most recently in mid-May.
1.0050 provided support for the pair in May 2013 and in other occasions beforehand. It remains a barrier before parity. The very round number of USD/CAD parity is a clear line and has provided support since mid-February.
0.9910 was last tested in January, which marked the start of a strong US dollar rally which saw USD/CAD climb to the mid-1.03 range.
The final support line for now is the round number of 0.9800. This line marked the low point of a rally by the US dollar in April 2012, which saw the pair climb above 1.04. This line has remained in place since October.
I remain bullish on USD/CAD
US Unemployment Claims continues to look strong and the markets will be looking for some clues as to QE tapering, which could start as early as September. This is a dollar-positive event, so increased speculation about a move by the Federal Reserve could give a boost to the US dollar. Canadian releases have not looked impressive, as underscored by this week’s Manufacturing Production, and further weak releases would likely weigh on the loonie.
Further reading:
- For a broad view of all the week’s major events worldwide, read the USD outlook.
- For EUR/USD, check out the Euro to Dollar forecast.
- For the Japanese yen, read the USD/JPY forecast.
- For GBP/USD (cable), look into the British Pound forecast.
- For the Australian dollar (Aussie), check out the AUD to USD forecast.
- USD/CAD (loonie), check out the Canadian dollar.
