The Canadian dollar lost ground last week, as USD/CAD gained around 150 points. The pair closed just below the 1.05 line, at 1.0491. This week’s major release is GDP. Here is an outlook on the major market-movers and an updated technical analysis for USD/CAD.
Canadian releases slumped last week, as Wholesale Sales and Core Retail Sales surprised the markets with sharp declines. The US dollar took full advantage of these weak releases and posted strong gains. The greenback also received a boost from the FOMC minutes, which indicated that the Fed appears likely to wind up QE in the near future.
[do action=”autoupdate” tag=”USDCADUpdate”/]USD/CAD daily chart with support and resistance lines on it. Click to enlarge: 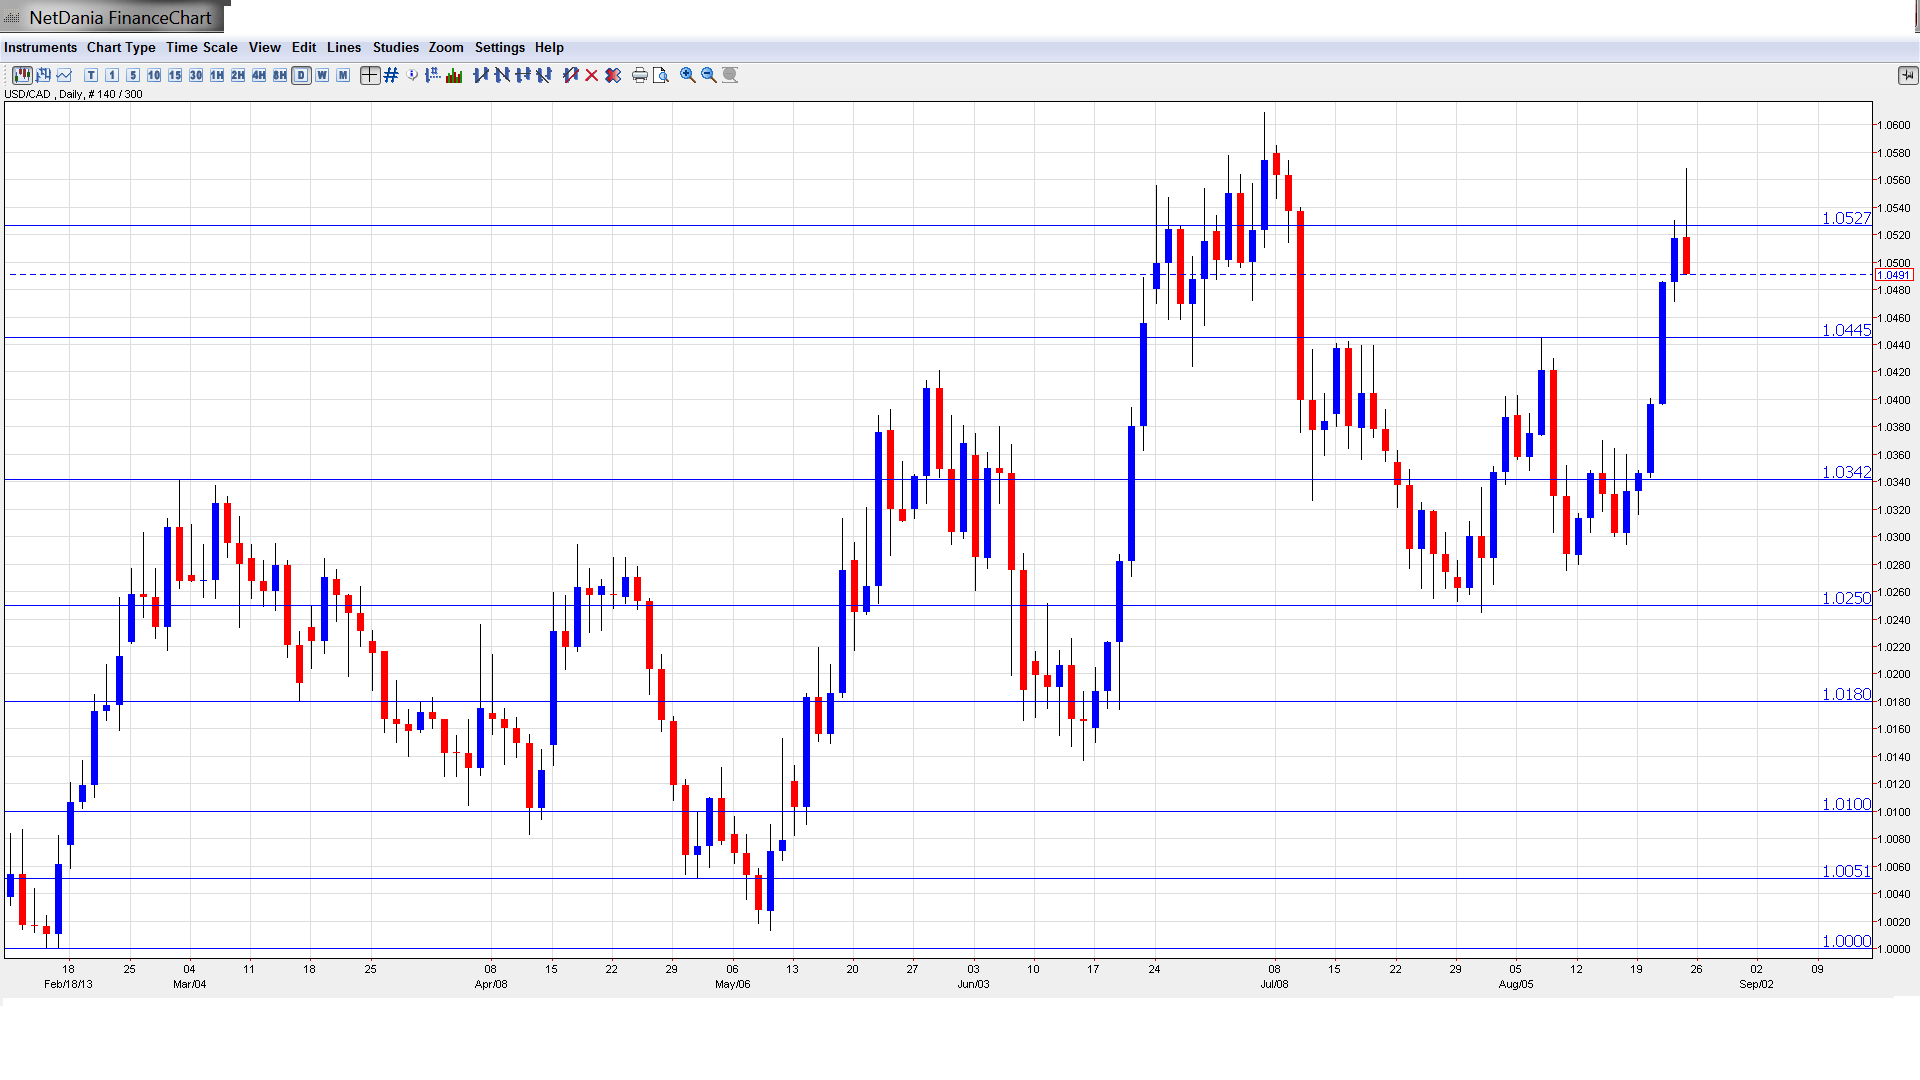
- Corporate Profits: Tuesday, 12:30. Corporate Profits was a disappointment in July, posting a decline of -1.2%. This came the indicator posted two consecutive gains. This indicator also helps gauge hiring, as increased business profits often translates into expansion and increased hiring. The markets will be hoping that the indicator improves and crosses back into positive territory.
- BOC Deputy Governor John Murray Speaks: Thursday, 16:45. Murray will address a business forum in Kingston, Ontario. Analysts will be looking for clues as to the BOC’s future monetary policy, and a speech that is considered hawkish could help the Canadian dollar.
- Current Account: Thursday, 12:30. Canada continues to produce current account deficits. However the July release of -14.1 billion dollars was an improvement from the previous month and beat the estimate. The forecast for the August release calls for a larger deficit, with an estimate of -14.9 billion dollars.
- RMPI: Thursday, 12:30. RMPI measures the change in prices of raw materials purchased by manufacturers and is an important inflation indicator. The previous release pointed to a weak gain of just 0.2%, but the estimate for the August release is sharply higher, at 1.2%.
- GDP: Friday, 12:30. GDP is one of the most important economic indicators and provides a snapshot of the health and direction of the economy. Canada releases GDP on a monthly basis, unlike the US and other major economies which release GDP on a quarterly basis. GDP has been posting small gains in recent readings and the July release came in at 0.2%. However, the markets are braced for a decline in August, with an estimate of -0.3%. Will the key indicator surprise the markets and remain in positive territory?
* All times are GMT.
USD/CAD Technical Analysis
USD/CAD opened the week at 1.0333 and touched a low of 1.0316. The pair then took off, barreling past the 1.05 line and climbing to a high of 1.0568. USD/CAD retracted at the end of the week, closing at 1.0491, as resistance at 1.0523 (discussed last week) remained intact.
Live chart of USD/CAD:
[do action=”tradingviews” pair=”USDCAD” interval=”60″/]
Technical lines, from top to bottom:
With the Canadian dollar losing ground last week, we start at higher levels.
1.0958 is protecting the key 1.10 level. This line has remained intact since September 2009. This is followed by resistance at 1.0853, which has held since May 2010.
1.0660 was a cap in September 2010. USD/CAD then dropped sharply, falling below the 0.95 line.
1.0523 was a peak back in November 2011. It had provided strong resistance since July, but was briefly breached last week as the US dollar showed some strength. It is providing weak resistance and could be tested early in the week.
1.0446 was a cap in mid-July. The pair broke through this line and it has reverted to a support role. It is a weak line, and could face more pressure if the Canadian dollar can rebound after last week’s losses.
1.0340 began the week as weak resistance, and the pair easily broke through. It is currently providing strong support to the pair.
USD/CAD is receiving support at 1.0250. This line worked as support quite well in July. It has strengthened as the pair trades at higher levels.
1.0180 provided support for the pair during March, and saw a lot of activity in the first half of June. The round number of 1.01 was a trough back in July 2012 and switched to resistance afterwards. The line proved its strength several times in 2013, most recently in mid-May.
1.0050 provided support for the pair in May 2013 and in other occasions beforehand. It remains a barrier before parity. The very round number of USD/CAD parity is a clear line and has provided support since mid-February.
The final support line for now is 0.9910. This line was last tested in January, which marked the start of a strong US dollar rally which saw USD/CAD climb to the mid-1.03 range.
I remain bullish on USD/CAD
The Canadian economy continues to stumble, and a weak GDP release this week could hurt the Canadian dollar. In the US, the economy continues to improve, and speculation that the Fed could take action and taper QE as early as September has given the US dollar broad strength.
Further reading:
- For a broad view of all the week’s major events worldwide, read the USD outlook.
- For EUR/USD, check out the Euro to Dollar forecast.
- For the Japanese yen, read the USD/JPY forecast.
- For GBP/USD (cable), look into the British Pound forecast.
- For the Australian dollar (Aussie), check out the AUD to USD forecast.
- USD/CAD (loonie), check out the Canadian dollar.
