USDCHF daily analysis
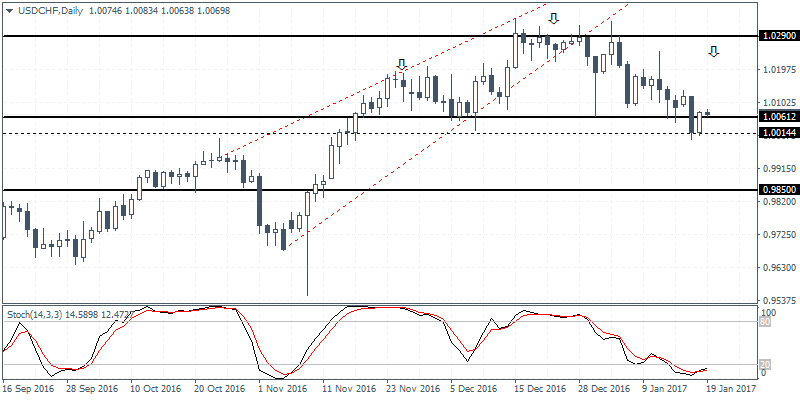
USDCHF (1.0069): USDCHF posted a strong reversal off the 1.0061 – 1.0014 support level and could see a near-term move to the upside. Expect USDCHF to continue making a minor correction to the upside towards 1.0231 – 1.0166 region where a potential reversal could take place thus forming the right shoulder of this evolving head and shoulders pattern. This could potentially mark the start of a correction lower towards 0.9850. However, failure to post a lower high near 1.0231 – 1.0166 could see USDCHF rally back towards 1.0290 which will be the line in the sand. A breakout above 1.0290 will invalidate the bearish bias and put USDCHF on the path to further gains.
NZDUSD intra-day analysis
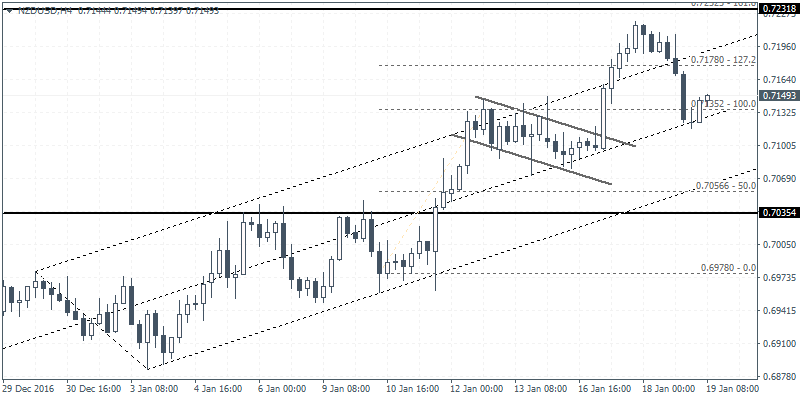
NZDUSD (0.7149): NZDUSD gave up some of the gains after hitting a top near 0.7200. Price action remains biased to the upside with the bullish flag intact. The recent declines have sent NZDUSD back to test the top resistance of the bullish flag pattern near $0.7135. As long as this previously marked resistance which is now being tested for support holds out, NZDUSD is poised to th upside with the eventual target towards $0.7231. Currently, the bias is to the upside after the bullish close on the 4-hour session following the doji pattern.
XAUUSD intra-day analysis
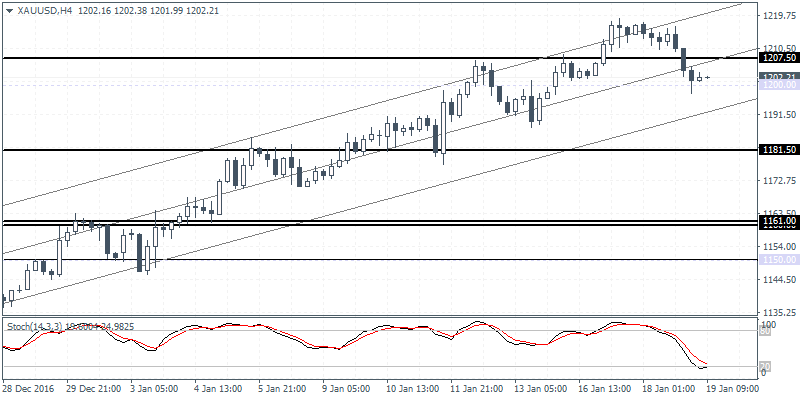
XAUUSD (1202.21): Gold prices were bearish yesterday forming an inside bar just after closing above the key price level of $1200.00. With the daily chart showing a hidden bearish divergence, gold prices are likely to post a short-term correction to the downside, subject to breaking down below the 1200 support level that is being tested currently. On the 4-hour chart, price action is showing signs of exhaustion at the current level, but the Stochastics oscillator is showing signs of a near-term consolidation in gold prices. Therefore, expect gold to remain trading sideways within $1207.50 – 1195 before the range is broken. The bias remains to the downside, for a test towards $1181.50 and eventually to the next support at $1161.00.
