USD/JPY had an uneventful week, posting slight gains. The pair closed at 108.67. The upcoming week is very light, with just three events on the schedule. Here is an outlook on the major events moving the yen and an updated technical analysis for USD/JPY.
In the US, both retail sales and inflation reports missed expectations, and the dovish Fed minutes have likely taken an April rate hike off the table. As well, consumer confidence numbers were well short of the estimate. In Japan, manufacturing indicators continued to point to a weak manufacturing sector, which has been hit hard by the Chinese slowdown.
do action=”autoupdate” tag=”USDJPYUpdate”/]
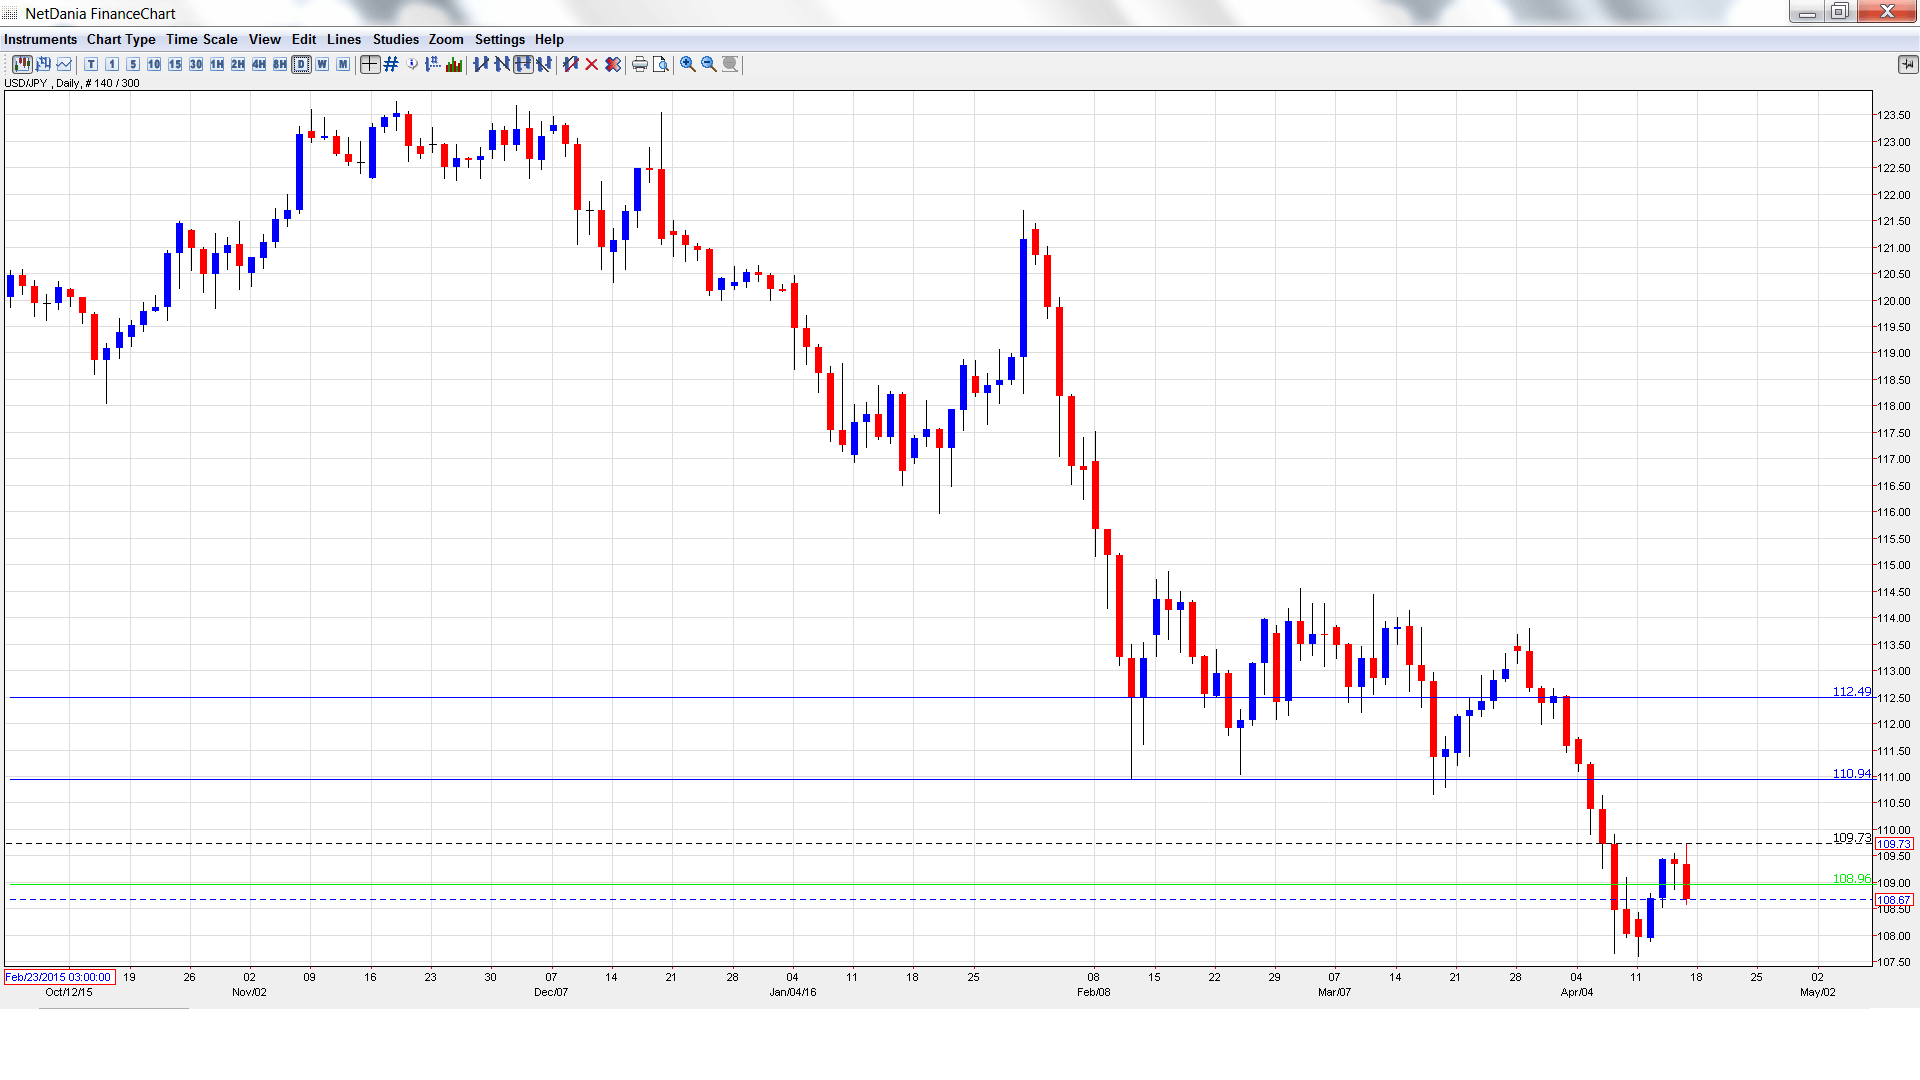
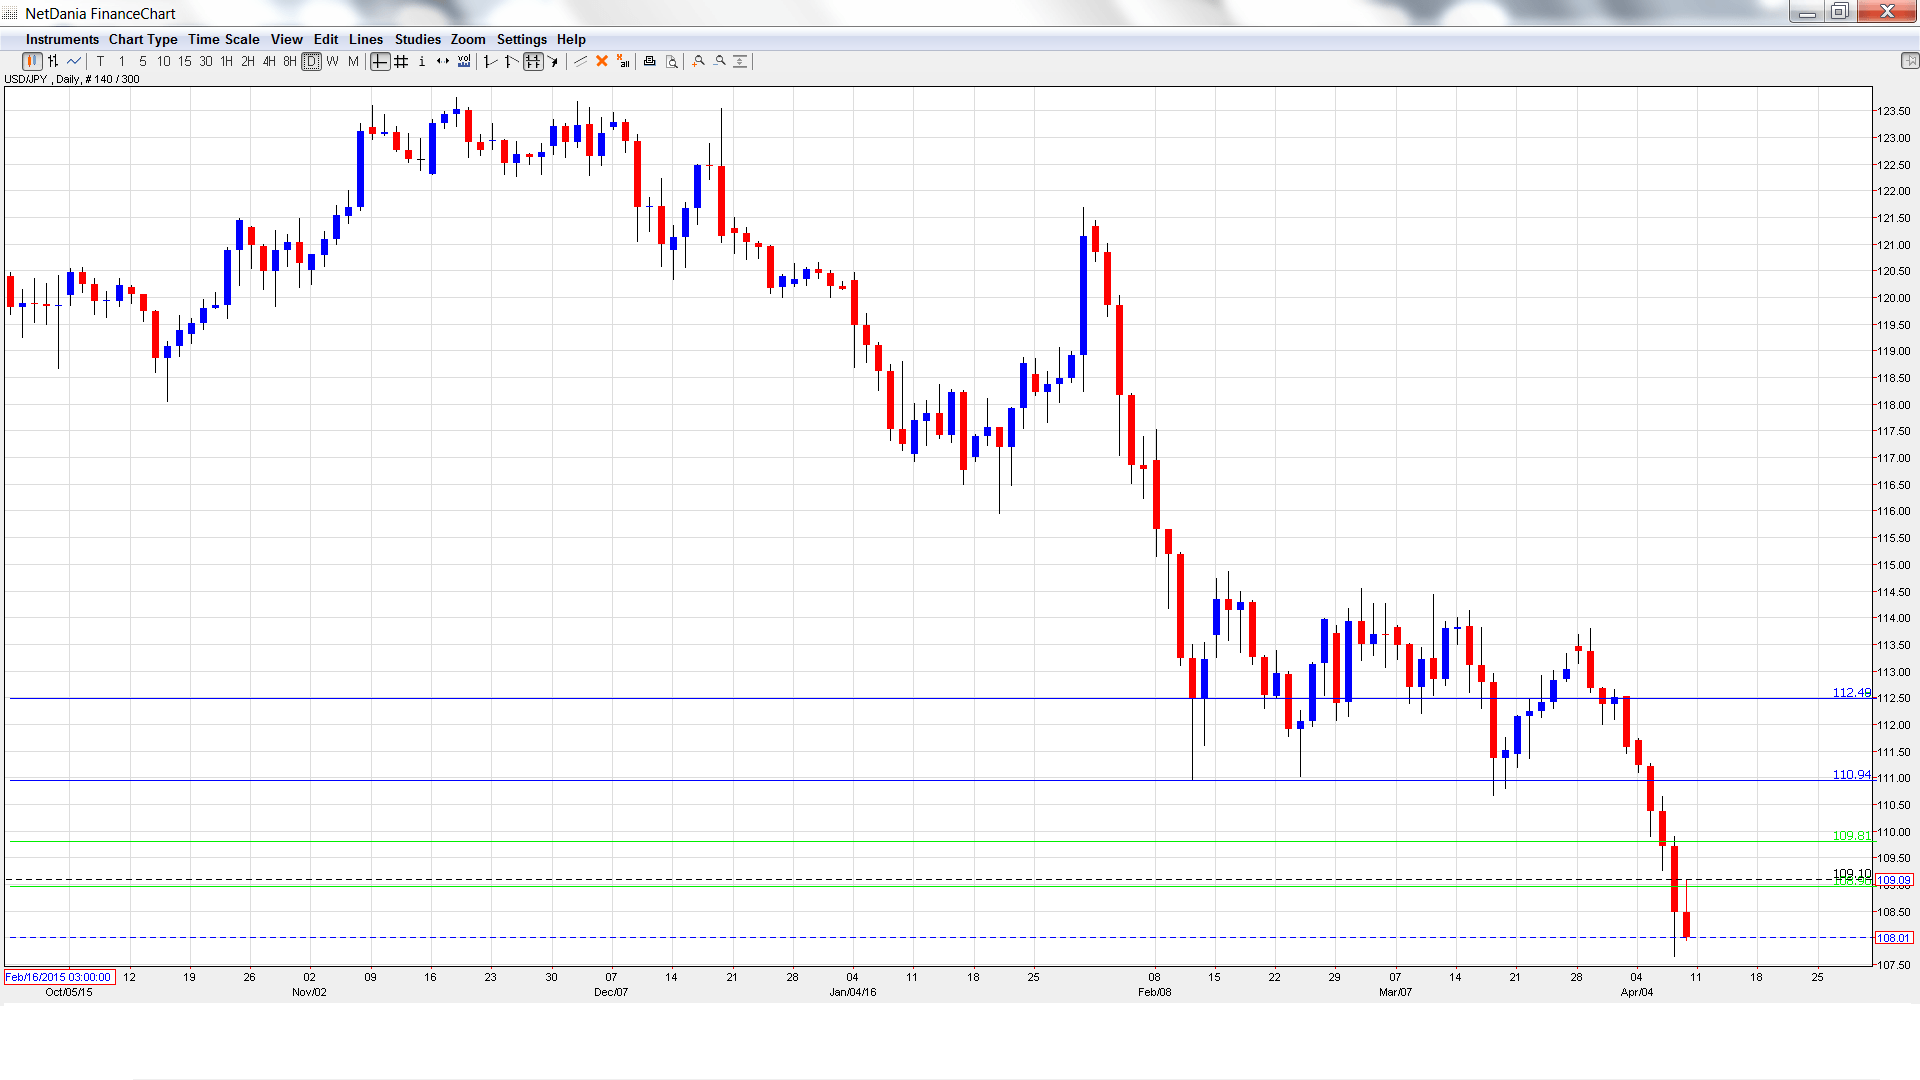
USD/JPY graph with support and resistance lines on it. Click to enlarge:
- Trade Balance: Tuesday, 23:50. Trade Balance continues to improve, as the trade surplus widened to JPY 0.17 trillion in February. However, this figure fell short of the estimate of JPY 0.24 trillion yen. The upward swing is expected to continue in March, with an estimate of JPY 0.45 trillion yen.
- Flash Manufacturing PMI: Friday, 2:00. Then PMI pointed to contraction in March, with a reading of 49.1 points. This was the first reading below 50 (which separates contraction from expansion) since May 2015. Another soft reading is expected in April, with an estimate of 49.6 points.
- Tertiary Industry Activity: Friday, 4:30. This indicator provides a snapshot of the level of activity in the business sector. The indicator posted a strong gain of 1.5% in January, crushing the estimate of 0.4%. The markets are bracing for a decline in February, with the estimate standing at -0.4%.
* All times are GMT
USD/JPY Technical Analysis
USD/JPY opened the week at 108.29 and quickly touched a low of 107.60. The pair then reversed directions and climbed to a high of 109.73, as resistance held firm at 109.81 (discussed last week). USD/JPY closed the week at 108.67.
Live chart of USD/JPY: [do action=”tradingviews” pair=”USDJPY” interval=”60″/]
Technical lines from top to bottom:
112.48 is a strong resistance line. The line marked the start of a yen rally in January 2008, which saw USD/JPY drop below the 100 level.
110.94 was a cushion February.
108.95 was a cushion in May 2006. It is a weak resistance line.
107.39 is providing support.
106.25 marked the start of a dollar rally in October 2014 which saw USD/JPY move above the 121 line.
105.19 was a cushion in October 2014.
104.25 is the final support line for now.
I am bearish on USD/JPY
The yen is considered a safe-haven asset, and weak global demand has fueled demand for the Japanese currency, which has appreciated sharply in 2016 against the dollar. With an oil producers meeting in Doha unlikely to achieve a cap on output, oil prices could fall, which could lead to more investors snapping up the yen.
In our latest podcast go on a Euro-trip
Follow us on Sticher or on iTunes
Further reading:
- For a broad view of all the week’s major events worldwide, read the USD outlook.
- For EUR/USD, check out the Euro to Dollar forecast.
- For the Japanese yen, read the USD/JPY forecast.
- For GBP/USD (cable), look into the British Pound forecast.
- For the Canadian dollar (loonie), check out the Canadian dollar forecast.
- For the kiwi, see the NZD/USD forecast
