The Japanese yen remains at 7-year lows, as USD/JPY climbed above 118 last week. The pair closed at 118.55. The upcoming week is a quiet one, with just six events. Here is an outlook on the major events moving the yen and an updated technical analysis for USD/JPY.
Japanese retail sales and inflation numbers met expectations. In the US, the large batch of data before Thanksgiving was not impressive: durable goods orders were mixed, unemployment claims missed the estimate, and housing numbers softened. Still, the US dollar continues to surge forward and posted strong gains at the expense of the yen.
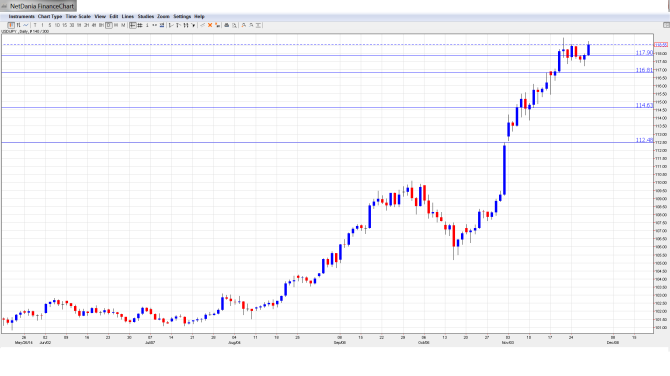
[do action=”autoupdate” tag=”USDJPYUpdate”/]USD/JPY graph with support and resistance lines on it:
- Capital Spending: Sunday, 23:50. This quarterly indicator looks at the total value of capital spending made by businesses. The indicator softened in Q2, with a gain of 3.0%, shy of the estimate of 3.8%. The Q3 reading is expected to dip to 2.1%.
- Final Manufacturing PMI: Monday, 1:35. The PMI has remained above the 50-point line in the second half of 2014, which indicates expansion in the manufacturing sector. The indicator came in at 52.1 points in the previous reading, and little change is expected in the upcoming release.
- Monetary Base: Monday, 23:50. Monetary Base rose slightly in October, coming in at 36.9%. More of the same is expected in the November reading, with an estimate of 37.2%.
- Average Cash Earnings: Tuesday, 1:30. Analysts are interested in employment income, as increased income means translates into greater spending, which is critical for economic growth.
- 10-year Bond Auction: Tuesday, 3:45. Yields on 10-year bonds have been decreasing and this trend continued last month, as yields slipped to 0.44%. Will the downward trend continue in the upcoming release?
- Leading Indicators: Tuesday, 5:00. This indicator is comprised of 11 leading indicators, but is considered a minor event, since most of the data has already been released. The forecast for the upcoming reading stands at 104.2%.
* All times are GMT
USD/JPY Technical Analysis
Dollar/yen started the week at 117.78. The pair touched a low of 117.23, as support held at 116.82 (discussed last week). USD/JPY then posted strong gains and climbed to a high of 118.77. USD/JPY closed the week at 118.55.
Live chart of USD/JPY: [do action=”tradingviews” pair=”USDJPY” interval=”60″/]
Technical lines from top to bottom:
We start with resistance at 122.19 ,which has held firm since July 2007. This is followed by 121.39.
119.88 is the last barrier before the psychologically important 120 line.
117.94 was breached and has switched to a support role.
116.82 has strengthened as the USD/JPY trades at higher levels.
114.65 has remained intact since December 2007, when the yen was in the midst of a strong yen rally which saw USD/JPY drop below the 96 line. 113.68 is next.
112.48 is the final support line for now. It has held firm since late October.
I am bullish on USD/JPY
Despite weak numbers last week, the US remains on track for a rate hike in 2015. With the Japanese economy in recession, there is further room for the yen to fall, as the psychologically important level of 120 looms closer.
In our latest podcast, we talk about holiday trading, run through the US situation, talk about the elections and the BOE and analyze China’s rate cut:
Subscribe to our podcast on iTunes.
Further reading:
- For a broad view of all the week’s major events worldwide, read the USD outlook.
- For EUR/USD, check out the Euro to Dollar forecast.
- For GBP/USD (cable), look into the British Pound forecast.
- For the Australian dollar (Aussie), check out the AUD to USD forecast.
- For USD/CAD (loonie), check out the Canadian dollar forecast.
- For the kiwi, see the NZDUSD forecast.
