The Japanese yen posted sharp gains last week, as USD/JPY dropped 220 points. The pair closed at the 121 line. The upcoming week has five events on the schedule, highlighted by the Tankan Indices. Here is an outlook on the major events moving the yen and an updated technical analysis for USD/JPY.
In the US, key releases were satisfactory, led by retail sales and inflation numbers which met expectations late in the week. Expectations of a rate hike at the all important Fed policy meeting have been priced in by the markets. In Japan, GDP was stronger than expected, giving the yen a big boost.
do action=”autoupdate” tag=”USDJPYUpdate”/]
USD/JPY graph with support and resistance lines on it:
- Tankan Manufacturing Index: Sunday, 23:50.The Tankan Indices are key economic barometers that should be treated as market-movers. The Manufacturing Index slipped to 12 points in Q3, which was within expectations. The forecast for Q4 stands at 11 points.
- Tankan Non-Manufacturing Index: Sunday, 23:50. The index has been improving steadily over the past four readings, and climbed to 25 points in Q3, beating the forecast of 21 points. Another strong reading is expected in Q4, with the estimate standing at 23 points.
- Revised Industrial Production: Monday, 4:30. Preliminary Industrial Production for October came in at 1.4%, short of the forecast of 1.9%. The estimate for Revised Industrial Production stands at 1.1%. Will the indicator beat this prediction?
- Trade Balance: Wednesday, 23:50. Japan’s trade deficit narrowed to JPY 0.20 trillion yen in October, its smallest deficit in five months. This figure was much better than the forecast of JPY 0.38 trillion. More of the same is expected in the November release, with an estimate of JPY 0.21 trillion.
- BOJ Monetary Policy Statement: Friday, Tentative. The week wraps up with this key indicator. The minutes provide details of the BOJ’s most recent policy meeting. Any discussion about additional easing steps could push the yen downwards.
* All times are GMT
Live chart of USD/JPY: [do action=”tradingviews” pair=”USDJPY” interval=”60″/]
USD/JPY Technical Analysis
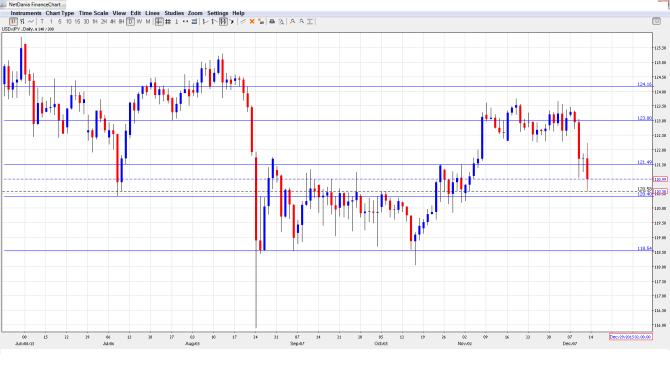
USD/JPY opened the week at 123.19 and quickly climbed to a high of 123.47, as resistance held firm at 124.16 (discussed last week). It was all downhill from there, as the pair dropped to a low of 120.58 and put strong pressure on 120.40. USD/JPY closed the week at 120.99.
Technical lines from top to bottom:
With the yen posting sharp gains, we start at lower levels:
124.16 was an important cap in late June.
The round number of 123 has switched to a resistance role. It is a weak line.
121.50 is the next line of resistance.
120.40, which was a swing low in July, is next.
118.55 has held firm since early October. It is the final support level for now.
I am bullish on USD/JPY
A historic rate hike by the Federal Reserve is widely expected, and the sheer significance and excitement of such an event will likely give the greenback a push upwards, at least for a brief period. At the same time, strong Tankan readings out of Japan could blunt a strong rise by the pair.
Our latest podcast is title Get Ahead of the Fed
Follow us on Sticher or on iTunes
Further reading:
- For a broad view of all the week’s major events worldwide, read the USD outlook.
- For EUR/USD, check out the Euro to Dollar forecast.
- For the Japanese yen, read the USD/JPY forecast.
- For GBP/USD (cable), look into the British Pound forecast.
- For the Australian dollar (Aussie), check out the AUD to USD forecast.
- For the kiwi, see the NZDUSD forecast.
