The Japanese yen rebounded in spectacular fashion last week, as USD/JPY plunged 470 points. The pair closed at 116.78. The upcoming week has seven events. Here is an outlook on the major events moving the yen and an updated technical analysis for USD/JPY.
The yen jumped on the dollar-selloff bandwagon last week, which followed a disappointing Services PMI out of the US. Weak US employment numbers last week also bolstered the Japanese currency. There were no major Japanese events last week.
do action=”autoupdate” tag=”USDJPYUpdate”/]
USD/JPY graph with support and resistance lines on it:
- Current Account: Sunday, 23:50. Japanese Current Account dipped in November to 1.42 trillion yen, well off the estimate of 1.52 trillion yen. The markets are expecting the indicator to rebound in December and climb to 1.59 trillion yen.
- Average Cash Earnings: Monday,1:30. This indicator is linked to consumer spending, a key driver of economic growth. The indicator posted a flat reading of 0.0% in November, short of the forecast of 0.7%. The December estimate remains unchanged at 0.7%.
- Economy Watchers Sentiment: Monday, 5:00. This indicator has been below the 50-level since July, indicative of ongoing pessimism among workers as to current economic conditions. The indicator did improve to 48.7 points in December, beating the estimate of 46.7 points. Little change is expected in the January forecast, with the estimate standing at 48.5 points.
- M2 Money Stock: Monday, 23:50. This indicator has been steadily losing ground in recent months and dropped to 3.0% in December, short of the estimate of 3.1%. The forecast for the January report stands at 3.1%.
- 30-year Bond Auction: Tuesday, 3:45. The yield on 30-year bonds came in at 1.22% in January, compared to 1.40% in the previous release. Will the downward trend continue in the upcoming auction?
- Preliminary Machine Tool Orders: Tuesday, 6:00. This indicator continues to record sharp declines, indicative of ongoing weakness in the manufacturing sector. In December, the indicator slid badly, dropping by 25.8%.
- PPI: Tuesday, 23:50. PPI measures inflation in the manufacturing sector. The index has posted nine consecutive declines, and the trend is expected to continue in the January report, with a forecast of -2.8%.
* All times are GMT
Live chart of USD/JPY: [do action=”tradingviews” pair=”USDJPY” interval=”60″/]
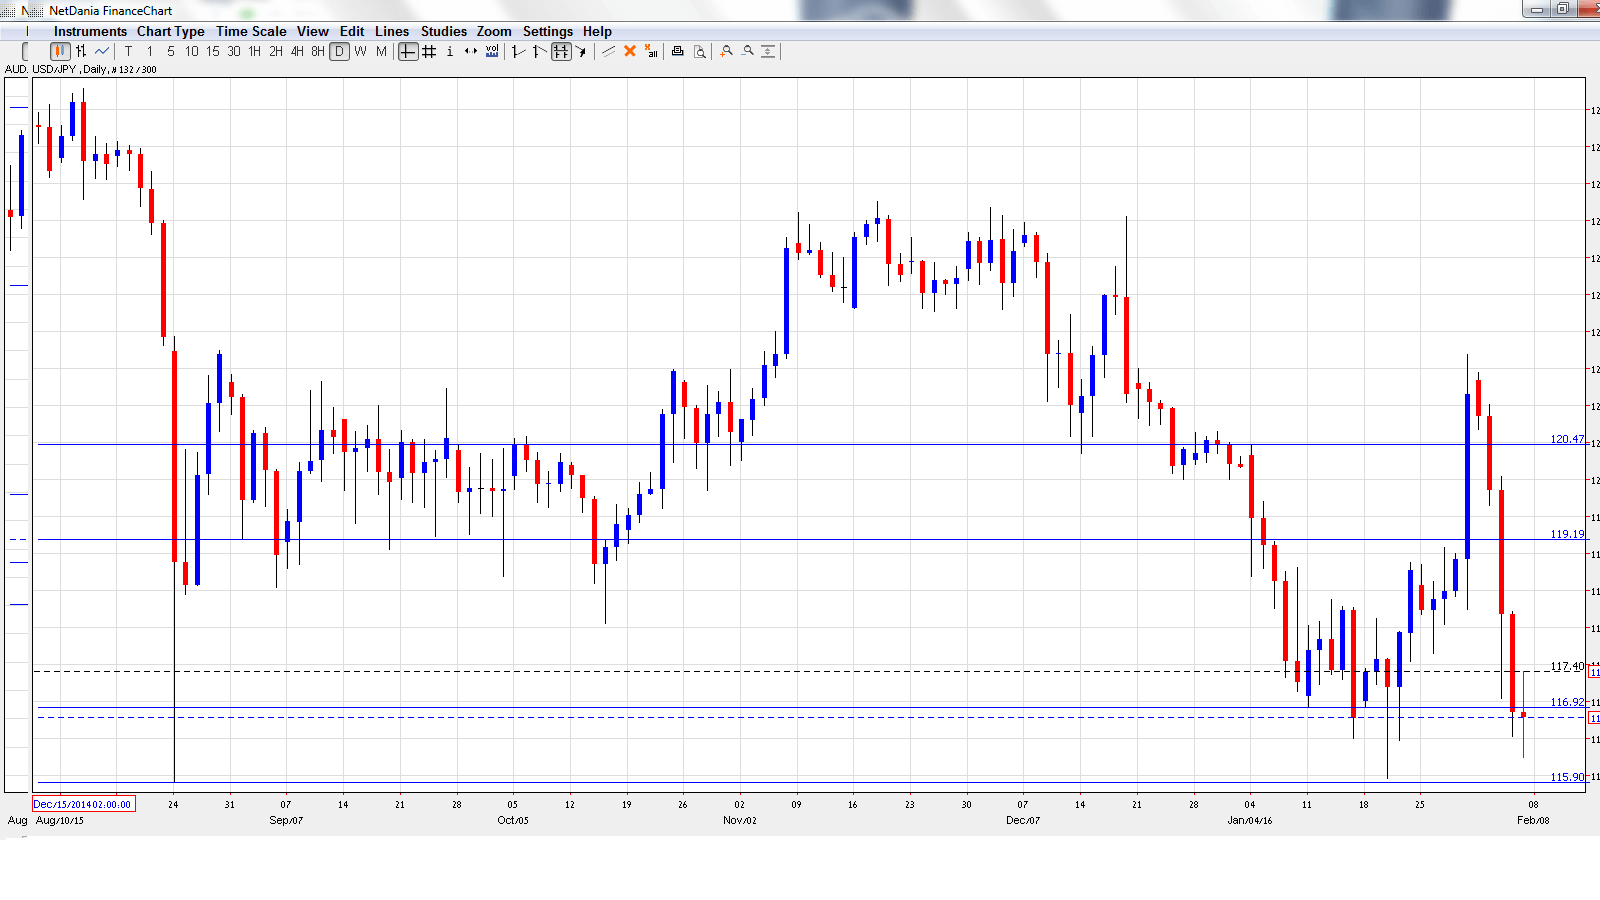
USD/JPY Technical Analysis
USD/JPY opened the week at 121.34 and quickly touched a high of 121.44. It was all downhill from there, as the pair dropped all the way to 116.24, breaking through resistance at 116.90 (discussed last week). USD/JPY closed the week at 116.78.
Technical lines from top to bottom:
With the pair posting sharp losses last week, we start at lower levels:
120.47 is a strong resistance line.
119.19 was easily breached as the yen posted sharp gains last week.
118.50 is the next resistance line. This line was easily breached last week.
116.90 supported dollar/yen early in 2015.
115.90 has provided support since November 2007.
114.65 is next.
113.71 was an important resistance line in July 2005.
112.48 is the final support level for now.
I am bullish on USD/JPY
After spectacular gains by the yen last week, will we see a correction? The Japanese economy struggling, and the Fed could raise rates as early as March. So monetary divergence clearly favors the US dollar.
Our latest podcast is titled Americans get a raise, negativity in Japan, Gas Naturally Low
Follow us on Sticher or on iTunes
Further reading:
- For a broad view of all the week’s major events worldwide, read the USD outlook.
- For EUR/USD, check out the Euro to Dollar forecast.
- For the Japanese yen, read the USD/JPY forecast.
- For GBP/USD (cable), look into the British Pound forecast.
- For the Australian dollar (Aussie), check out the AUD to USD forecast.
- For the kiwi, see the NZDUSD forecast.
