USD/JPY showed some movement last week, but closed almost unchanged at 102.46. This week has seven events. Here is an outlook on the major events moving the yen and an updated technical analysis for USD/JPY.
The yen settled down last week, after posting strong gains after the Brexit vote. Japanese consumer spending and inflation data was soft, but the yen managed to hold its own against the dollar. In the US, GDP posted came in at 1.1%, beating the estimate of 1.0%. The week wrapped up on a positive week, as ISM Manufacturing PMI beat expectations.
do action=”autoupdate” tag=”USDJPYUpdate”/]
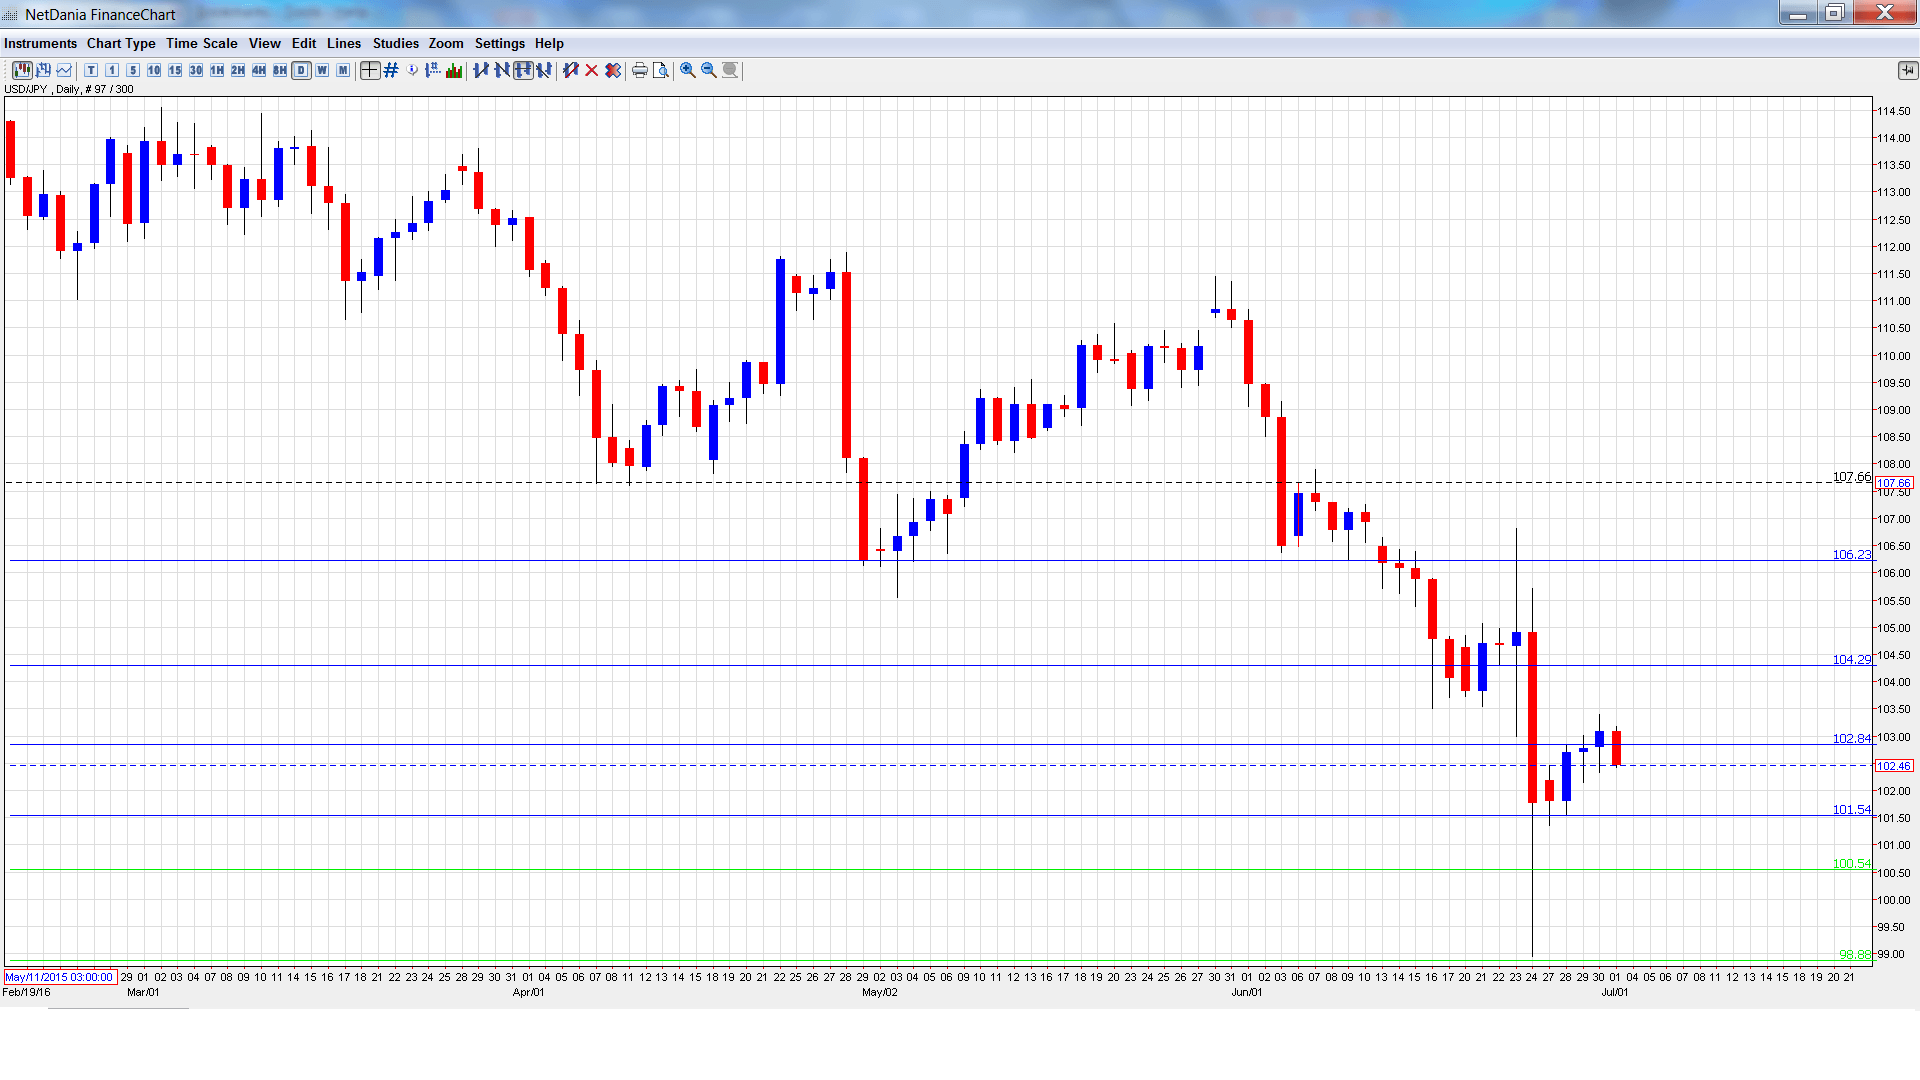
USD/JPY graph with support and resistance lines on it. Click to enlarge:
- Monetary Base: Sunday, 23:50. The indicator continues to lose ground, and dropped to 25.5% in May, short of the forecast of 27.2%. The estimate for the June report is 26.3%.
- 10-year Bond Auction: Tuesday, 3:45. Yields on 10-year bonds remain in negative territory. The June yield came in at -0.09%, little changed from the May auction.
- BOJ Governor Haruhiko Kuroda Speaks: Thursday, 00:30. Kuroda will deliver remarks at an event in Tokyo. The markets will be looking for hints regarding the BOJ’s future monetary policy plans.
- Leading Indicators: Thursday, 5:00. This event is composed of 11 economic indicators. The indicator improved to 100.5% in April, within expectations. Little change is expected in the May release.
- Current Account: Thursday, 23:50. This indicator is closely linked to currency demand. Japan’s current account surplus slipped to JPY 1.64 trillion in April, well short of the estimate of JPY 204 trillion. The downward trend is expected to continue in May, with an estimate of JPY 1.52 trillion.
- Average Cash Earnings: Friday, 00:00. This consumer spending indicator posted a weak gain of 0.3% in April, well below expectations The indicator is expected to rise to 0.5% in the May report.
- Economy Watchers Sentiment: Friday, 5:00. The indicator remains well below the 50-point level, pointing to a pessimistic Japanese consumer. The indicator came in at 43.0 points in May, and the June estimate is 42.9 points.
* All times are GMT
USD/JPY Technical Analysis
USD/JPY opened the week at 102.18 and touched a low of 101.35, testing support at 101.54 (discussed last week). The pair then reversed directions and climbed to a high of 103.39, before retracting and closing at 102.46.
Live chart of USD/JPY: [do action=”tradingviews” pair=”USDJPY” interval=”60″/]
Technical lines from top to bottom:
We start with resistance at 106.25.
105.19 was a cushion in October 2014.
104.25 is next.
102.80 was tested in resistance and is an immediate resistance line.
101.51 is providing support. It was a cushion in August 2014.
100.54 is next.
99.71 was a cushion in May 2009.
98.88 is next.
97.78 is the final support level for now.
I am bearish on USD/JPY
The BoJ may be out of monetary ammunition, unable to provide easing to kick-start the weak economy. This means that the yen could move higher. As well, further Brexit aftershocks could boost the safe-haven Japanese currency.
Our latest podcast is titled Brexit Boiling Point
Follow us on Sticher or on iTunes
Further reading:
- For a broad view of all the week’s major events worldwide, read the USD outlook.
- For EUR/USD, check out the Euro to Dollar forecast.
- For the Japanese yen, read the USD/JPY forecast.
- For GBP/USD (cable), look into the British Pound forecast.
- For the Canadian dollar (loonie), check out the Canadian dollar forecast.
- For the kiwi, see the NZD/USD forecast
