USD/JPY was uneventful and closed the week almost unchanged. The pair closed at 106.78. This week is very light, with only three events on the schedule. Here is an outlook on the major events moving the yen and an updated technical analysis for USD/JPY.
In the US, expectations for a June rate hike have lessened following a cautious speech from Janet Yellen. US employment numbers bounced back after the awful NFP report, as JOLT Job Openings and Unemployment Claims beat expectations. Japanese Final GDP posted a respectable gain of 0.5%, matching the estimate.
do action=”autoupdate” tag=”USDJPYUpdate”/]
USD/JPY graph with support and resistance lines on it. Click to enlarge:
- BSI Manufacturing Index: Sunday, 19:50. This minor event is released on a quarterly basis. The Q4 reading disappointed, declining 7.9 points. This was much worse than the estimate of a 4.2 point gain. Another decline is expected in Q1, with an estimate of -2.1 points.
- Revised Industrial Production: Tuesday, 00:30. This manufacturing indicator rebounded nicely in March, posting a gain of 3.8%, within expectation. The previous release came in at -5.2%. The markets are expecting a turnaround in April, with a forecast of 0.4%.
- BoJ Monetary Policy Statement: Wednesday, Tentative. The policy statement is the key event of the week. The BoJ is under strong pressure to adopt further monetary moves, given the lackluster economy and weak growth. Will the BoJ make a move or opt to stay on the sidelines? The statement will be followed by a press conference.
* All times are GMT
USD/JPY Technical Analysis
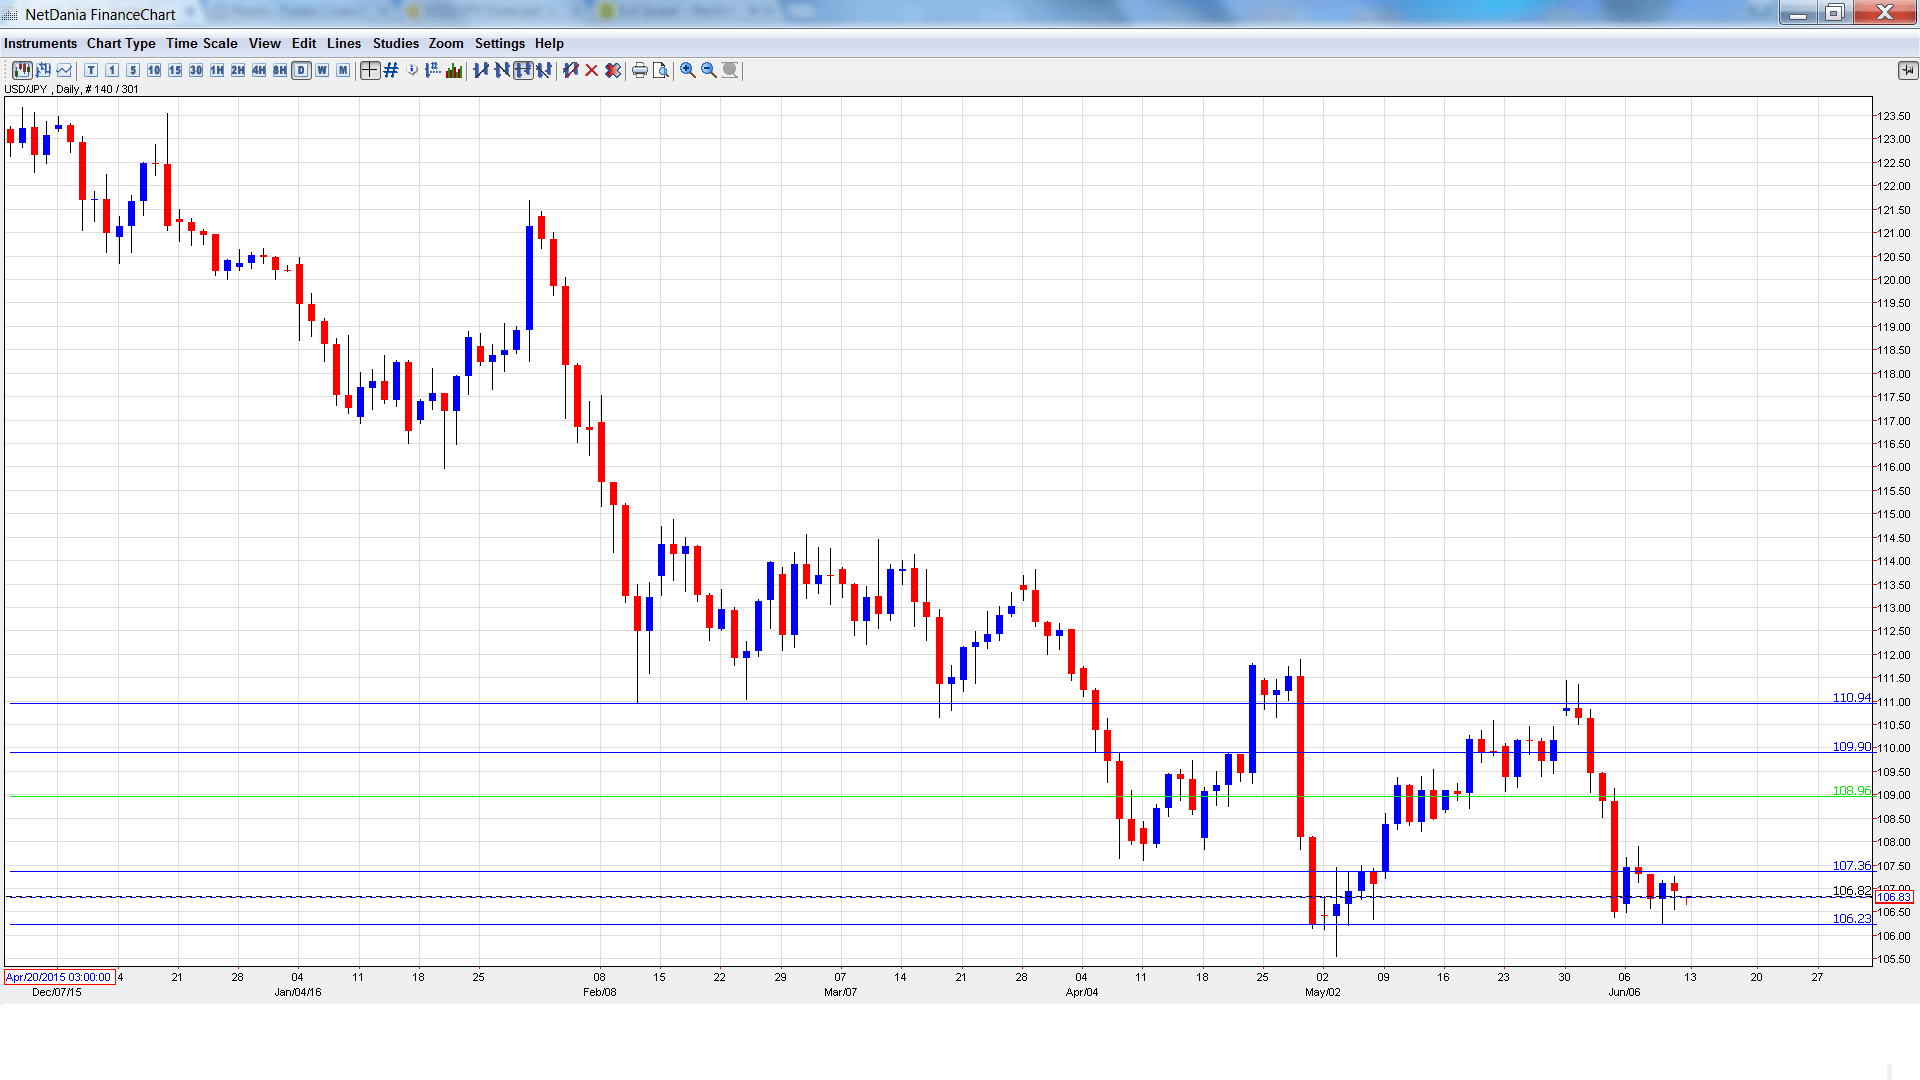
USD/JPY opened the week at 106.67 and touched a high of 107.90. The pair then reversed directions and dropped to a low of 106.23, testing support at 106.25 (discussed last week). USD/JPY closed the week at 106.78.
Live chart of USD/JPY: [do action=”tradingviews” pair=”USDJPY” interval=”60″/]
Technical lines from top to bottom:
110.94 was an important support level in February.
109.90 was a cap for much of April.
108.95 was a cushion in May 2006.
107.39 is an immediate resistance line.
106.25 remains busy and was tested in support last week.
105.19 was a cushion in October 2014.
104.25 is a strong support line.
102.80 is the final support level for now.
I am neutral on USD/JPY
US job numbers appear to have stabilized after a dismal NFP, and market sentiment towards the US economy remains positive. The yen is again showing some strength, and if the BoJ opts to stay on the sideline and refrains from adopting further easing measures, the yen could move higher.
Our latest podcast is titled Oil, Brexit and the Big Fed Preview
Follow us on Sticher or on iTunes
Further reading:
- For a broad view of all the week’s major events worldwide, read the USD outlook.
- For EUR/USD, check out the Euro to Dollar forecast.
- For the Japanese yen, read the USD/JPY forecast.
- For GBP/USD (cable), look into the British Pound forecast.
- For the Canadian dollar (loonie), check out the Canadian dollar forecast.
- For the kiwi, see the NZD/USD forecast
