The Japanese posted strong gains for a second straight week. USD/JPY closed at 111.22, its lowest weekly close since November 2016. This week’s key event is Household Spending. Here is an outlook for the highlights of this week and an updated technical analysis for USD/JPY.
In the US, Fed Chair Yellen sent out a dovish message after the rate hike, disappointing the markets. Unemployment Claims were unexpectedly weak, soaring to 261 thousand. In Japan, the trade surplus was much stronger than expected, helping to boost the Japanese currency.
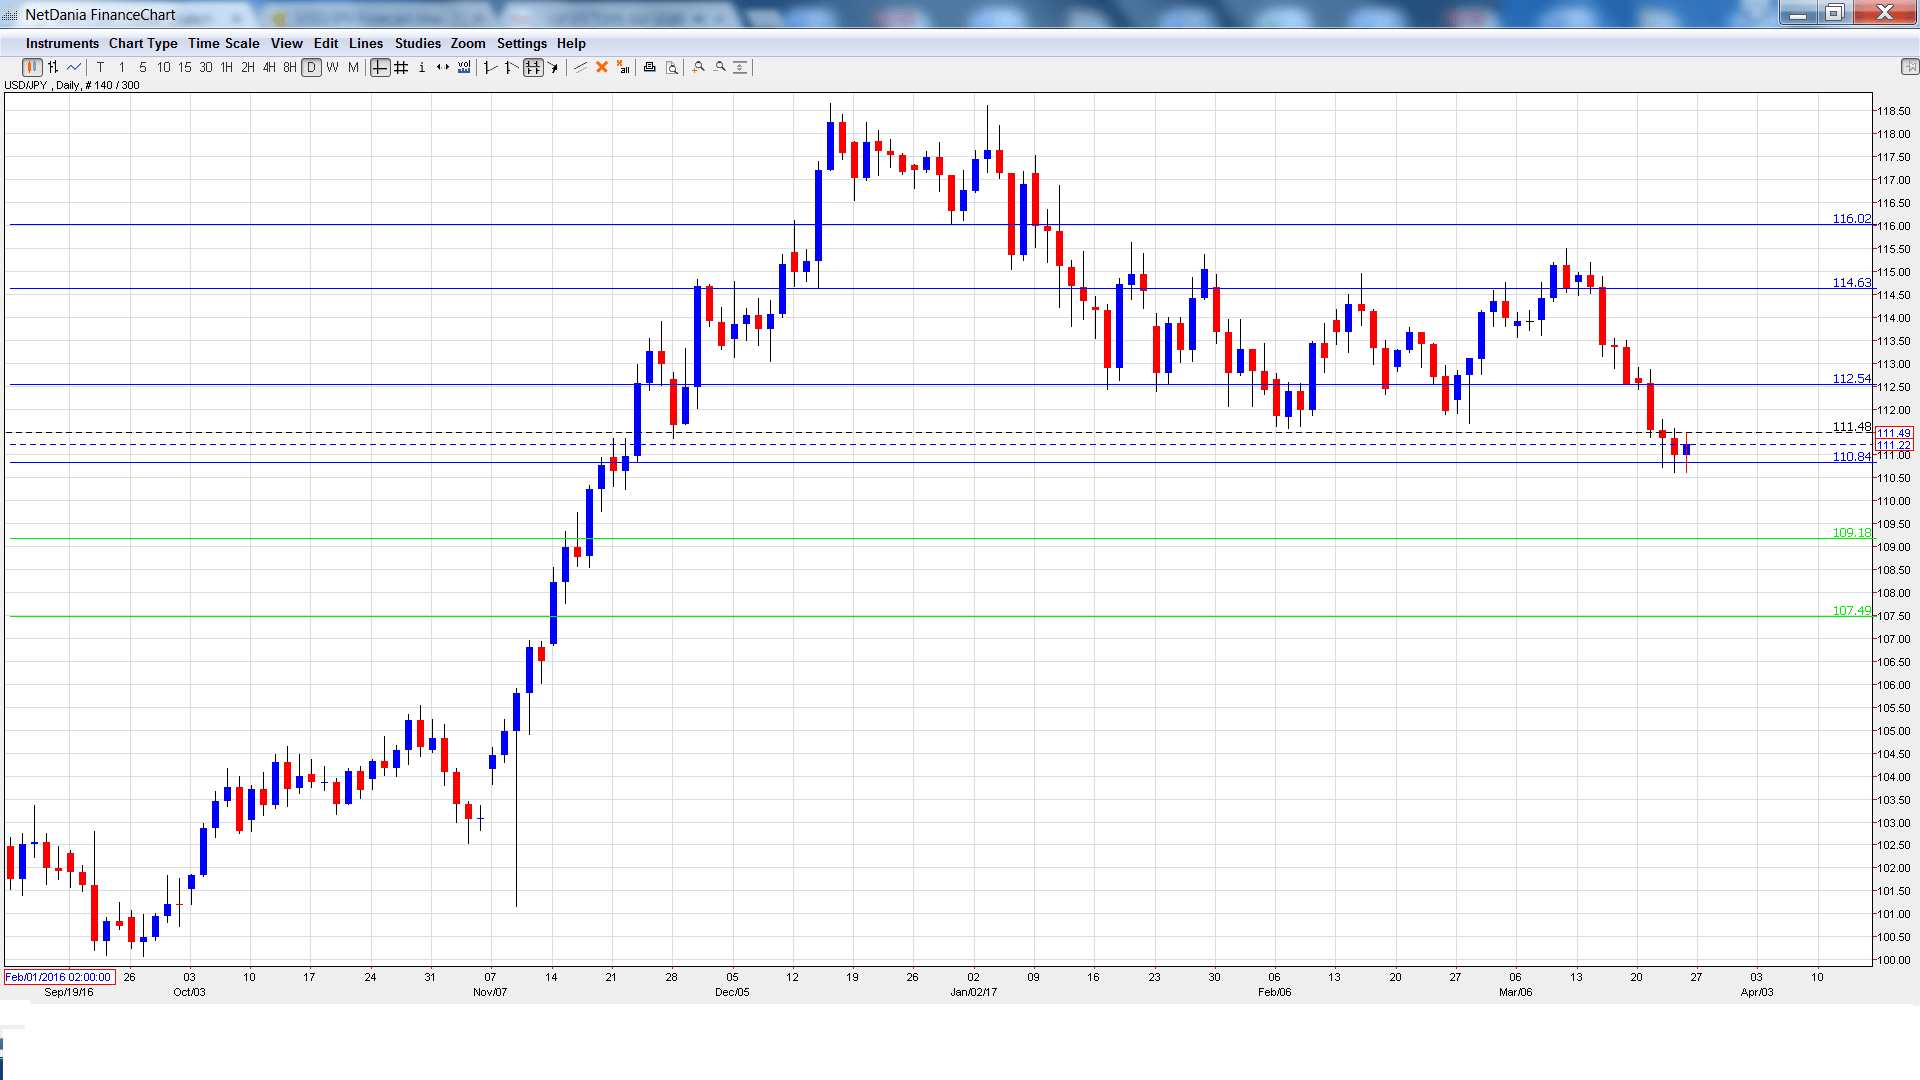
[do action=”autoupdate” tag=”USDJPYUpdate”/]USD/JPY graph with support and resistance lines on it. Click to enlarge:
- BoJ Summary of Opinions: Sunday, 23:50. This minor report includes the central bank’s projections for inflation and economic growth. Analysts will be looking for clues as to the BoJ’s future monetary policy.
- Retail Sales: Tuesday, 23:50. Retail Sales improved in January to 1.0%, edging above the forecast of 0.9%. The estimate for the February report stands at 0.7%.
- Household Spending: Thursday, 23:30. This is the key event of the week. The indicator continues to post declines, as the Japanese consumer is holding tight on her purse strings. The January reading of -1.2% was well below expectations, and a sharp decline of 1.6% is expected in the February report.
- Preliminary Industrial Production: Thursday, 23:50. The indicator disappointed in January, with a decline of 0.8%. The markets are expecting a strong rebound in February, with an estimate of +1.3%.
- Housing Starts: Friday, 5:00. Housing Starts tends to show strong fluctuation, making accurate forecasts tricky. In January, the indicator jumped 12.8%, crushing the forecast of 3.3%. The markets are braced for a decline in February, with an estimate of -1.2%.
USD/JPY opened the week at 112.67 and quickly climbed to a high of 112.90. It was all downhill from there, as the pair plunged to a low of 110.61, testing support at 110.83 (discussed last week). USD/JPY closed the week at 111.22.
Technical lines from top to bottom:
We start with resistance at 116.02.
114.63 was a cushion in December 2016 and January 2017.
112.53 has switched to resistance following strong losses for USD/JPY.
110.83 is providing support.
109.18 marked the start of a rally in September 2008 which saw USD/JPY drop close to the 0.87 level.
107.49 is the final support line for now.
I am neutral on USD/JPY
In the US, the Fed has sent clear signals that it is projecting two more rate hikes this year. This has disappointed the markets and lowered investors’ appetite for risk. Still, the US economy continues to perform well, and monetary divergence favors the US dollar.
Our latest podcast is titled Murky markets and further Fed fallout
Follow us on Sticher or iTunes
Safe trading!
Further reading:
- For a broad view of all the week’s major events worldwide, read the USD outlook.
- For EUR/USD, check out the Euro to Dollar forecast.
- For the Japanese yen, read the USD/JPY forecast.
- For GBP/USD (cable), look into the British Pound forecast.
- For the Canadian dollar (loonie), check out the Canadian dollar forecast.
- For the kiwi, see the NZD/USD forecast.
