USD/JPY reversed directions last week, losing about 80 points. USD/JPY closed the week at 120.58. The upcoming week is a quiet one, with six events on the schedule. Here is an outlook on the major events moving the yen and an updated technical analysis for USD/JPY.
In Japan Retail Sales disappointed with a decline of 0.2%, missing expectations. Japanese inflation indicators continued to point to deflation in the economy. In the US, workers wages were up sharply in Q3, as the Employment Cost Index posted a gain of 0.6%. UoM Consumer Sentiment improved to 90 points, within expectations.
do action=”autoupdate” tag=”USDJPYUpdate”/]
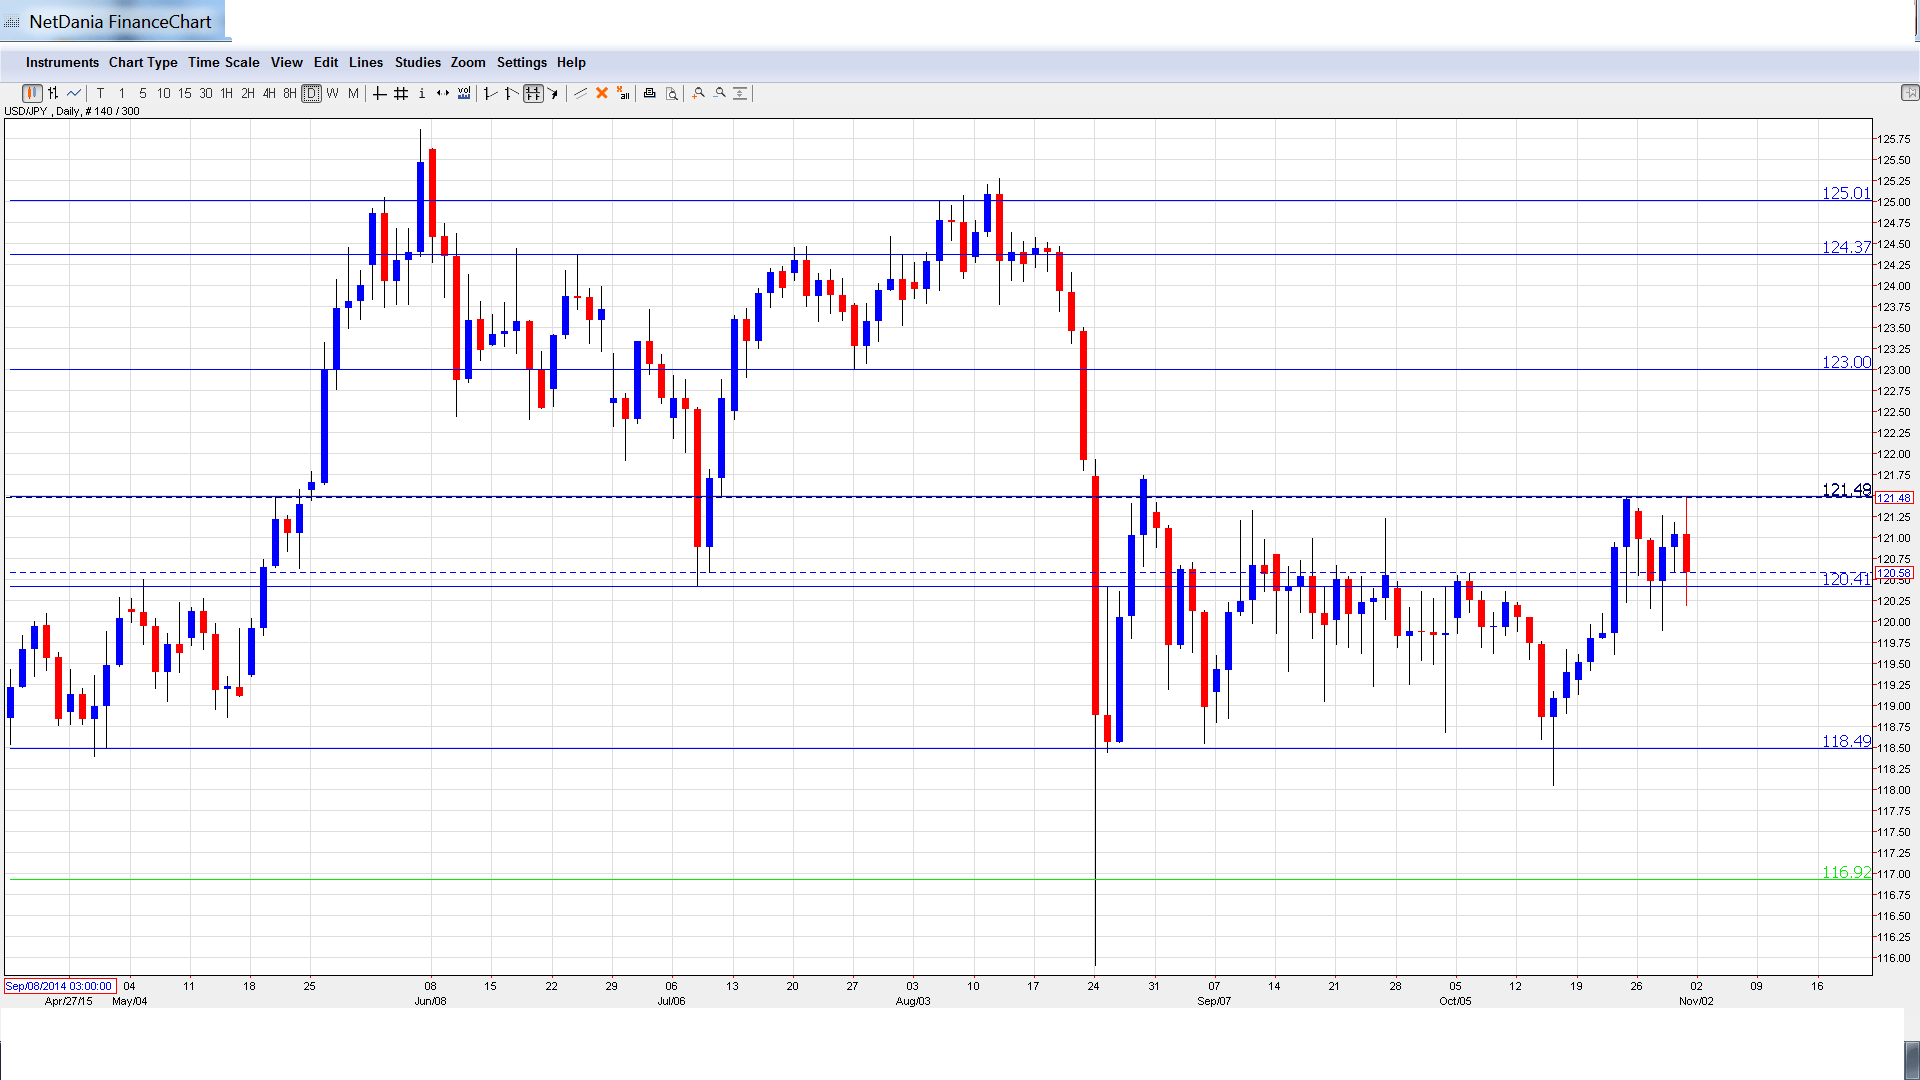
USD/JPY graph with support and resistance lines on it:
- Final Manufacturing PMI: Monday, 1:35. This index has hovered above the 50-point line (which separates contraction from expansion) for the past five months, and came in at 51.0 points in October, close to the estimate of 50.9 points. The November reading stands at 52.1 points.
- Monetary Base: Tuesday, 23:50. The BOJ Monetary Base has been rising in recent readings, and hit 35.1% in September, beating the estimate of 34.2%. The upward trend is expected to continue in the October report, with a forecast of 36.2%.
- Consumer Confidence: Wednesday, 5:00. Analysts closely follow consumer confidence, as greater confidence often translates into increased consumer spending, which is a key driver of economic growth. The indicator continues to post readings well below the 50-level, pointing to pessimism. In September, the indicator dipped to 40.6 points, shy of the estimate of 41.6 points.
- BOJ Monetary Policy Meeting Minutes: Wednesday, 23:50. The minutes provide details of the BOJ’s October policy meeting. The central bank is under strong pressure to increase monetary easing, and any hints of such measures in the minutes could send the yen lower.
- 10-year Bond Auction: Thursday, 3:45. The average yield on 10-year bonds has been slipping, and the October yield came in at 0.34%. Will the downward trend continue in the upcoming release?
- Leading Indicators: Friday, 5:00. This minor event is based on 11 economic indicators. The indicator has been on a downward trend in recent readings, and dipped to 103.5% in September. This trend is expected to continue, with the October estimate standing at 102.1%.
* All times are GMT
Live chart of USD/JPY: [do action=”tradingviews” pair=”USDJPY” interval=”60″/]
USD/JPY Technical Analysis
USD/JPY opened the week at 121.31 and dropped to a low of 119.13. The pair then reversed directions, and climbed to high of 121.48, putting strong pressure on resistance at 121.50 (discussed last week). USD/JPY closed the week at 120.58.
Technical lines from top to bottom:
We begin at the very round number of 125.
The next line is at 124.37.
The round number of 123 was a swing low in July and remains of importance.
121.50 was the high in September and a key resistance line.
120.40, which was a swing low in July, remains busy. It was tested last week and is a weak support line.
118.50 has held firm since early October.
116.90 supported dollar/yen early in the year.
I am bullish on USD/JPY
With a Fed rate hike in 2015 back on the table, the US dollar may look more attractive to investors and could make gains against its rivals. With deflation concerns and the economy continuing to struggle, the BOJ may have to implement additional easing measures in an attempt to kick-start the economy.
Further reading:
- For a broad view of all the week’s major events worldwide, read the USD outlook.
- For EUR/USD, check out the Euro to Dollar forecast.
- For the Japanese yen, read the USD/JPY forecast.
- For GBP/USD (cable), look into the British Pound forecast.
- For the Australian dollar (Aussie), check out the AUD to USD forecast.
- For the kiwi, see the NZDUSD forecast.
