The Japanese yen rebounded last week, as USD/JPY dropped 140 points. The pair closed at 102.51. There are only three events this week. Here is an outlook for the highlights of this week and an updated technical analysis for USD/JPY.
In the US, a key services report disappointed, as ISM Non-Manufacturing PMI sagged to 51.4 points, its worst showing since 2010. There was some good news from the Japanese economy, as Final GDP gained 0.2% in Q2, above the estimate of 0.0%.
do action=”autoupdate” tag=”USDJPYUpdate”/]
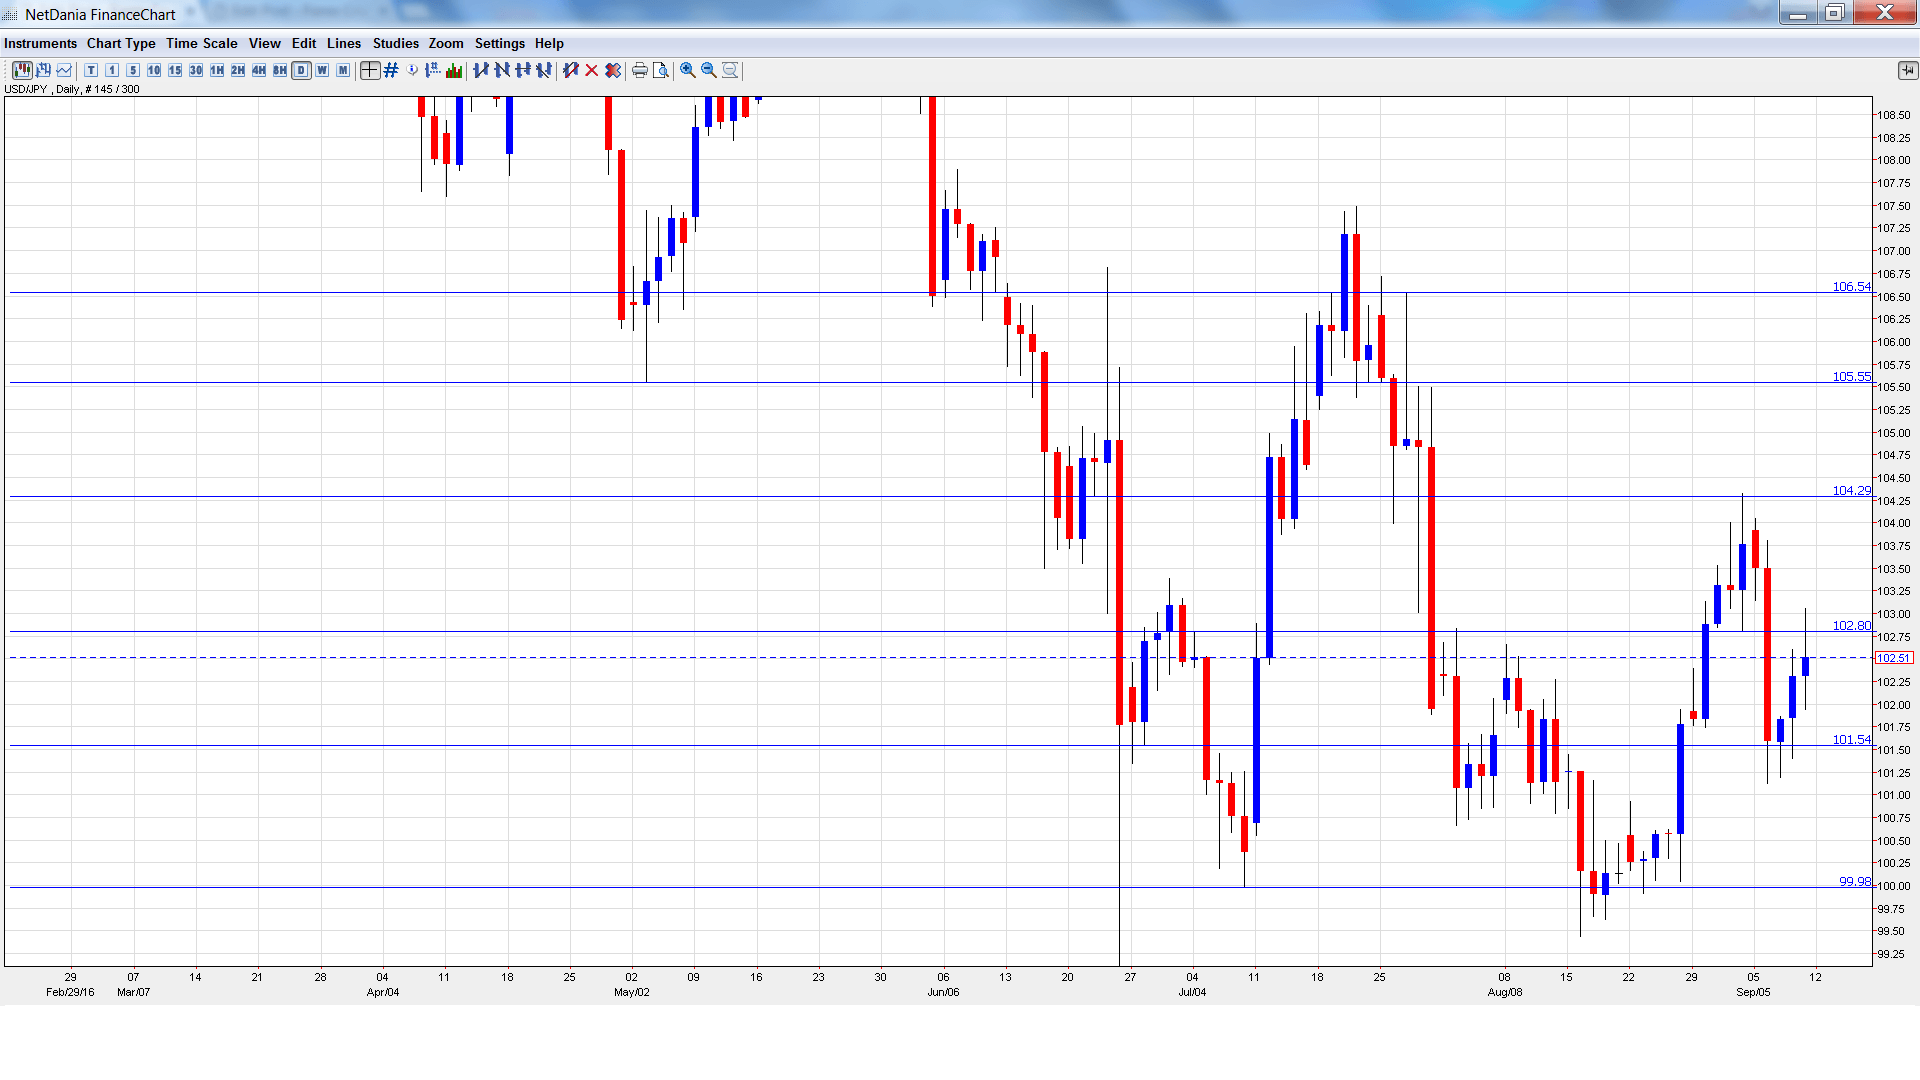
USD/JPY graph with support and resistance lines on it. Click to enlarge:
- Core Machinery Orders: Sunday, 23:50. After two straight declines, the indicator bounced back with an impressive gain of 8.3% of June. This figure easily beat the forecast of 3.4%. However, the markets are braced for a decline in the July report, with an estimate of -2.8%.
- Preliminary Machine Tool Orders: Monday, 6:00. This manufacturing indicator continues to post declines, although the declines have moderated slightly in recent readings. The July reading came in at -19.6%, down a bit from -19.6% a month earlier.
- BSI Manufacturing Index: Monday, 23:50. This important manufacturing indicator is released each quarter, magnifying the impact of each reading. The index posted a sharp decline of 11.1 points in Q1, worse than the estimate of -2.1 points. The estimate for Q2 is -6.5 points.
- Revised Industrial Production: Wednesday, 4:30. The estimate for the July reading stands at 0.0%, identical to the Preliminary Industrial report in late August. Will the indicator beat the prediction and push into positive territory?
* All times are GMT
USD/JPY Technical Analysis
USD/JPY opened the week at 103.92 and quickly touched a high of 104.05, as resistance held firm at 104.25 (discussed last week). The pair then reversed directions and dropped to a low of 101.13, testing support at 101.51 before rebounding higher. USD/JPY closed the week at 102.51.
Live chart of USD/JPY:
Technical lines from top to bottom:
With USD/JPY posting sharp gains last week, we start at higher levels:
We start with resistance at 106.54.
105.55 was a cushion in May and June.
104.25 held firm early in the week before USD/JPY posted sharp losses.
102.83 has switched to resistance. It is a weak line and could see further action early in the week.
101.51 is next.
99.98 is just below the symbolic round number of 100.
98.95 has provided support since late June. It is the final support line for now.
I remain bullish on USD/JPY
The Bank of Japan has stayed on the sidelines, for months, but could adopt further easing measures at next week’s policy meeting. The US is headed in the opposite direction, with the Fed signaling that it could take action and raise rates before the end of the year.
Our latest podcast explains what really happens on jobs day.
Follow us on Sticher or iTunes
Further reading:
- For a broad view of all the week’s major events worldwide, read the USD outlook.
- For EUR/USD, check out the Euro to Dollar forecast.
- For the Japanese yen, read the USD/JPY forecast.
- For GBP/USD (cable), look into the British Pound forecast.
- For the Canadian dollar (loonie), check out the Canadian dollar forecast.
- For the kiwi, see the NZD/USD forecast
