USD/JPY is taking in the view at 6-year highs, as the yen shed over 200 points last week. The pair closed on Friday above the 107 level. The upcoming week is a quiet one, with only four events on the calendar. Here is an outlook on the major events moving the yen and an updated technical analysis for USD/JPY.
Japanese GDP sagged with a sharp decline, while manufacturing data was a mix. US employment data was soft, but consumer confidence and retail sales beat the estimates.
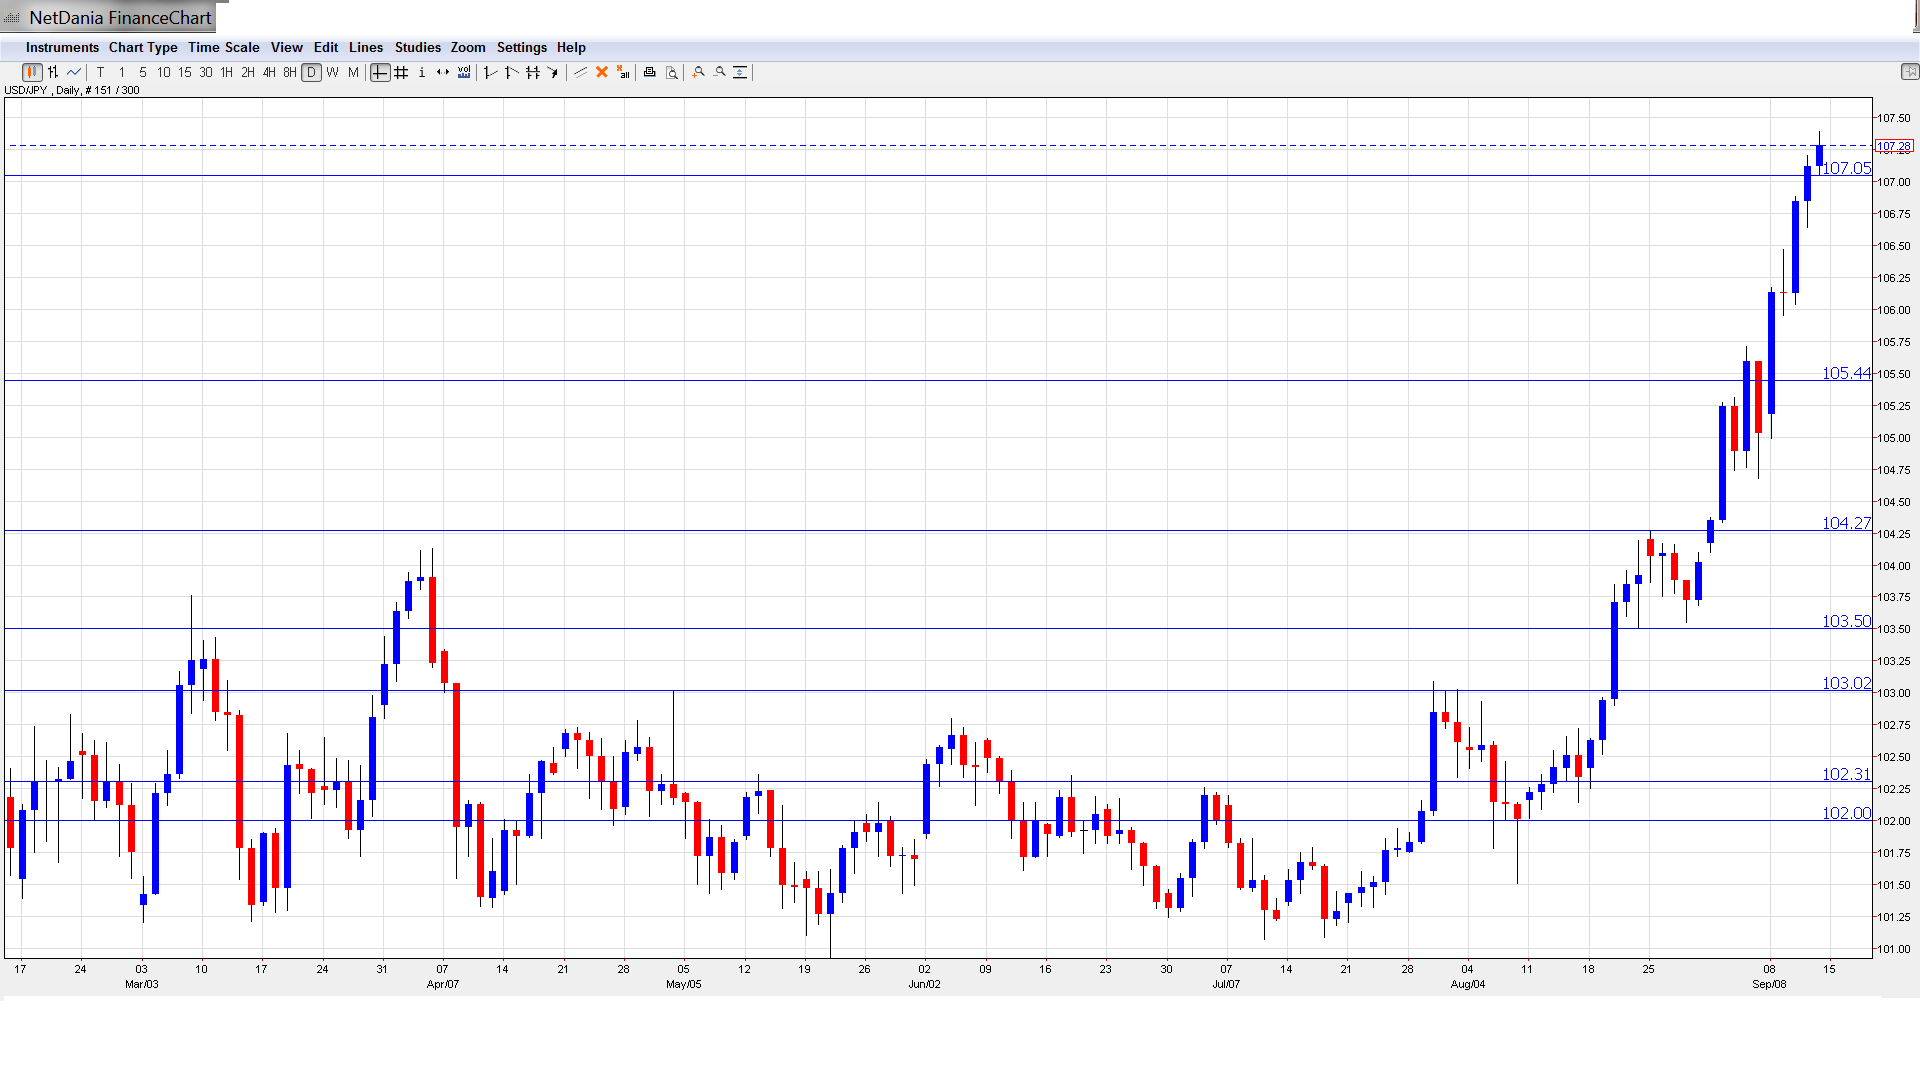
[do action=”autoupdate” tag=”USDJPYUpdate”/]USD/JPY graph with support and resistance lines on it:
- BOJ Governor Haruhiko Kuroda Speaks: Tuesday, 5:30. Kuroda will host a press conference in Osaka. The markets will be listening closely, looking for hints as to future monetary policy.
- Trade Balance: Wednesday, 23:50. Trade Balance is directly linked to currency demand, as foreigners must purchase yen to pay for Japanese exports. Last month, the trade deficit narrowed to JPY -1.02 trillion, but this was much higher than the estimate of JPY -0.77 trillion. The markets are expecting the deficit to edge lower in August, with an estimate of JPY -0.99 trillion.
- BOJ Governor Haruhiko Kuroda Speaks: Tuesday, 6:35. Kuroda will deliver remarks at a financial convention in Tokyo. A speech that is more hawkish than expected is bullish for the British pound.
- All Industries Activity: Friday, 4:30. This is considered a minor release as much of the data has already been released. The indicator came in at – 0.4% last month, slightly lower than the estimate of -0.2%. The markets expecting a turnaround in the upcoming release, with the estimate standing at +0.4%.
* All times are GMT
USD/JPY Technical Analysis
Dollar/yen started the week at 105.18 and touched a low of 104.99. The pair then climbed sharply, hitting a high of 107.39, as resistance held firm at 107.68 (discussed last week). The yen closed the week at 107.28.
Live chart of USD/JPY: [do action=”tradingviews” pair=”USDJPY” interval=”60″/]
Technical lines from top to bottom:
We start with resistance at 112.48. This line was important resistance in July 2004 and has remained intact since January 2008.
There is resistance at 110.68. This line represented a high point of a strong dollar rally in August 2008, which started around the key 100 level.
108.58 was last tested in June 2008.
107.68 has weakened as the pair trades above the 107 line. It was a key resistance line back in May 2005 and again in July 2008.
105.44 had held firm since December and has some breathing room as the pair trades at higher levels.
104.92 capped the pair around the turn of the year.
104.25 was an important resistance line back in August and continues to provide strong support.
It is followed by 1.0350, which was the bottom of the range after the big leap.
The round number of 103 has shown its strength in late July 2013.
In the narrower range, 102.30 is weak resistance.
102.00 is the final support line for now. It has supported the pair several times and remains an important line that the pair seemed to like very much – the “magnet”.
I am bullish on USD/JPY
The US economy continues to improve, while in Japan concerns grow that another sales tax hike could weigh heavily on the economy. A growing yield gap is favorable to the surging US dollar. The pair’s momentum is upward and we could see the yen continue to lose ground.
And subscribe on iTunes.
- For a broad view of all the week’s major events worldwide, read the USD outlook.
- For EUR/USD, check out the Euro to Dollar forecast.
- For GBP/USD (cable), look into the British Pound forecast.
- For the Australian dollar (Aussie), check out the AUD to USD forecast.
- For USD/CAD (loonie), check out the Canadian dollar forecast.
- For the kiwi, see the NZDUSD forecast.
