USD/JPY was almost unchanged last week, as the pair closed at 109.22. The upcoming week has 10 events, led by Household Spending, Retail Sales and the Tankan indices. Here is an outlook on the major events moving the yen and an updated technical analysis for USD/JPY.
It was an uneventful week in Japan, with the markets closed on Tuesday and only a handful of Japanese events. Inflation indicators, led by Tokyo Core CPI, met expectations. The US economy continued to post strong numbers, as New Home Sales beat the estimate and GDP sparkled with a 4.6% gain in Q2.
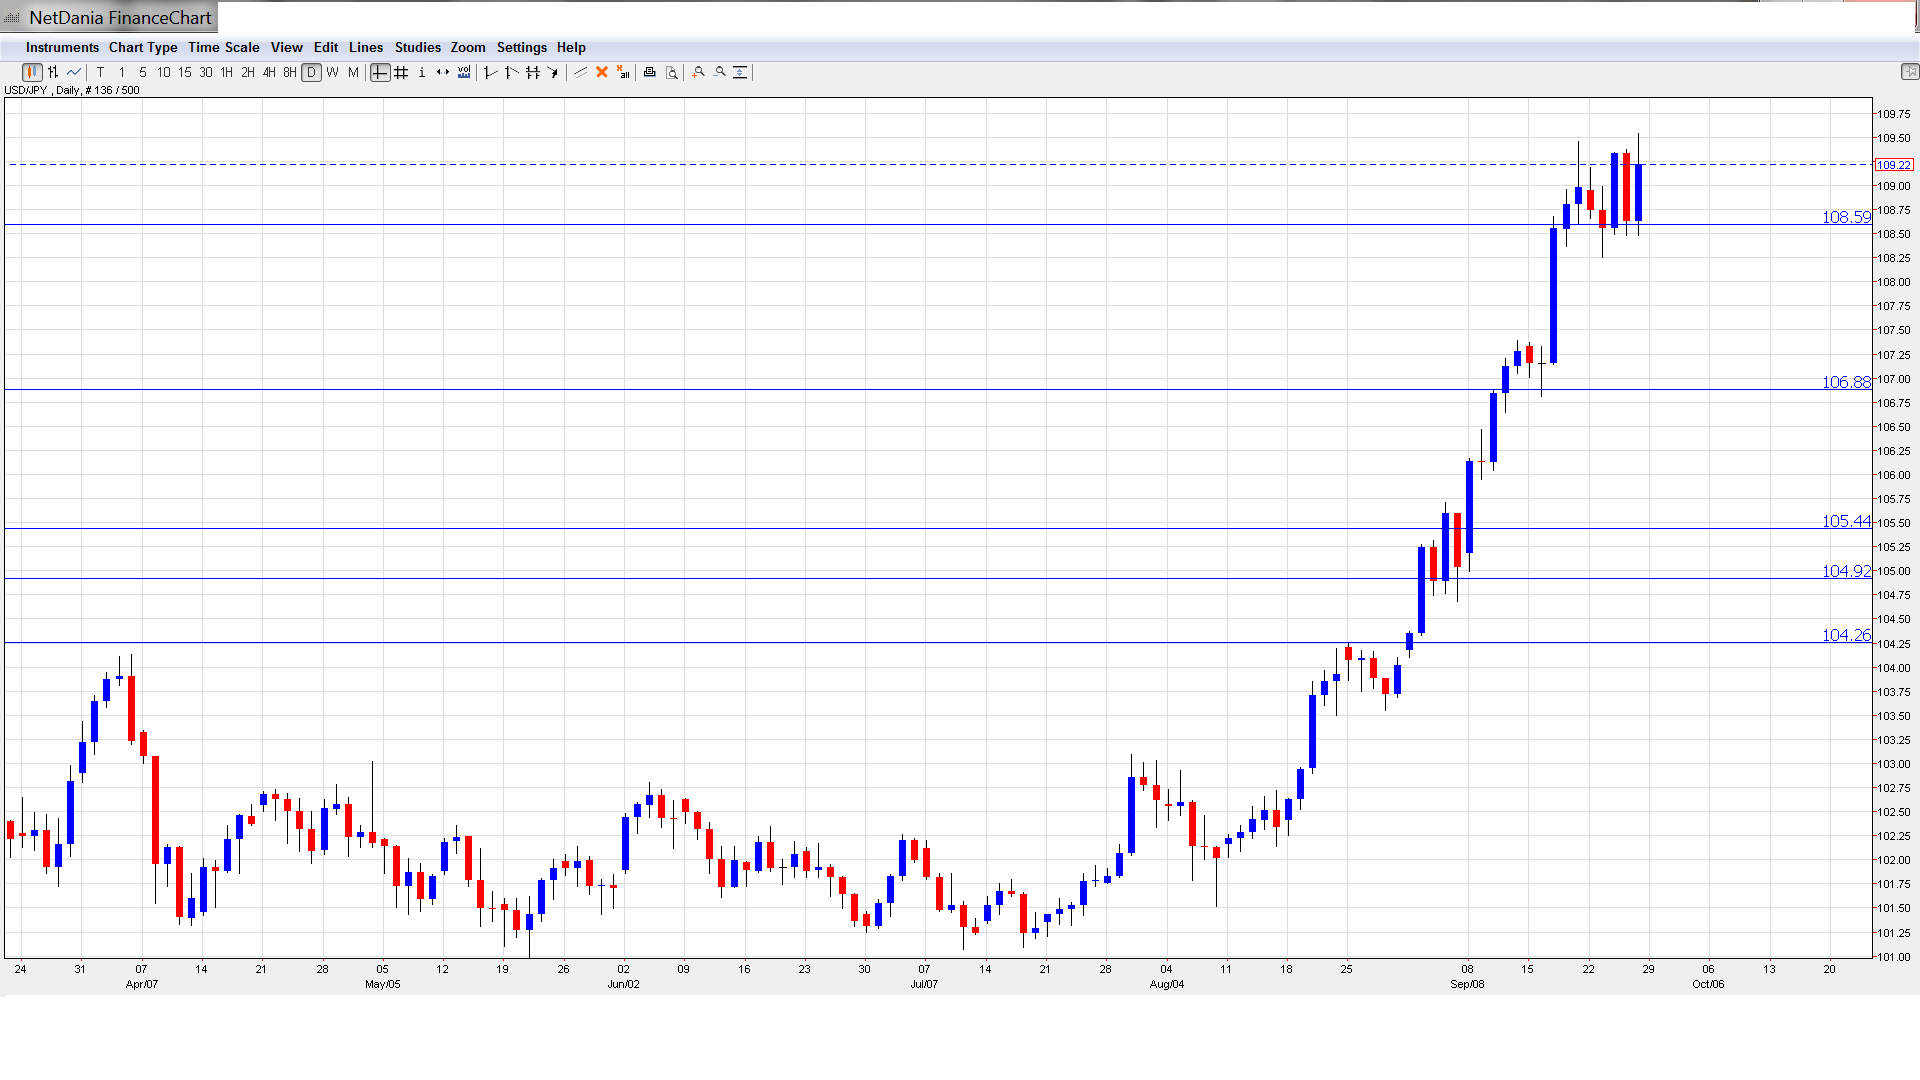
[do action=”autoupdate” tag=”USDJPYUpdate”/]USD/JPY graph with support and resistance lines on it:
- Household Spending: Monday, 23:30. Household Spending is an important gauge of consumer spending, which is a key component of economic growth. The indicator has been on a downward spiral, posted four straight declines. Last month, the indicator dropped 5.9%, much worse than the estimate of a 2.7% decline. Another drop is expected in the August release, with an estimate of -3.5%.
- Preliminary Industrial Production: Monday, 23:50. This indicator has been alternating between gains and declines in recent readings. In July, the indicator posted a small gain of 0.2%, well off the estimate of 1.2%. The estimate remains unchanged at 1.2% for the upcoming release.
- Retail Sales: Monday, 23:50. Retail Sales is one of the most important economic indicators and should be treated by traders as a market-mover. The indicator bounced back last month with a gain of 0.5%. This easily beat the estimate of -0.1%. Little change is expected in the August release, with an estimate of 0.4%.
- Average Cash Earnings: Tuesday, 1:30. This indicator measures the change in employment income, which is closely linked to consumer spending. The indicator jumped 2.6% last month, well above the forecast of 0.9%. The markets are expecting a gain of 1.1% in the August release.
- Housing Starts: Tuesday, 5:00. The indicator has posted five consecutive declines, pointing to a decrease in activity in the housing sector. The indicator came in at -14.9% last month, worse than the estimate of -10.3%. Another sharp drop is expected in the upcoming release, with an estimate of -13.9%.
- Tankan Manufacturing Index: Tuesday, 23:50. The Tankan indices, released each quarter, are important gauges of the health of the Japanese economy. The Manufacturing Index slipped to 12 points in Q1, shy of the estimate of 16 points. Little change is expected, with an estimate of 11 points.
- Tankan Non-Manufacturing Index: Tuesday, 23:50. This indicator is based on a survey of businesses in the service industry. The index softened in Q2 to 19 points, but his is still a strong reading. The estimate for Q2 stands at 17 points.
- Final Manufacturing PMI: Wednesday, 1:35. The indicator has been in growth mode since June, with readings above the 50-point level. The index came in at 52.2 points in July, very close to the forecast. The estimate for the upcoming release stands at 51.7 points.
- 10-year Bond Auction: Thursday, 3:45. The yield on 10-year bonds has been around 0.50% for the past two readings, and little change is expected at the upcoming auction.
* All times are GMT
USD/JPY Technical Analysis
Dollar/yen started the week at 108.95 and touched a low of 108.25, breaking below support at 108.58 (discussed last week). USD/JPY then climbed to a high of 109.54. The pair closed at 109.22.
Live chart of USD/JPY: [do action=”tradingviews” pair=”USDJPY” interval=”60″/]
Technical lines from top to bottom:
114.65 has provided resistance since December 2007.
112.48 marked the start of a yen rally in January 2008, which saw USD/JPY drop below the 100 level.
110.68 represented a high point of a strong dollar rally in August 2008, which started around the key 100 level.
108.58 started the week as immediate support. This line was breached early in the week but then recovered. It could face pressure early in the week.
106.88 is next. This line switched to a support role earlier in September.
105.44 had held firm since December.
104.92 capped the pair around the turn of the year.
104.25 was an important resistance line back in August and continues to provide strong support. It is the final support level for now.
I am bullish on USD/JPY
US numbers have looked solid, and the markets are expecting a strong NFP late in the week. The divergence in monetary policy is weighing on the yen, as the BoJ considers additional stimulus while the Fed is on the verge of wrapping up QE.
In our latest episode, we talk about Contango vs. Backwardation, Scottish reverberations and key US data:
- For a broad view of all the week’s major events worldwide, read the USD outlook.
- For EUR/USD, check out the Euro to Dollar forecast.
- For GBP/USD (cable), look into the British Pound forecast.
- For the Australian dollar (Aussie), check out the AUD to USD forecast.
- For USD/CAD (loonie), check out the Canadian dollar forecast.
- For the kiwi, see the NZDUSD forecast.
