EUR/USD is enjoying (or suffering) significant volatility. What’s next for the world’s most popular currency pair?
The team at Morgan Stanley examines the key triggers and provides three charts:
Here is their view, courtesy of eFXnews:
Morgan Stanley picks EUR/USD as its technical FX chart of the week, where MS is still bearish medium-term. In particular, MS provides the key trigger level (underlined below) to confirm the resumption of the next leg down of EUR/USD (base case) and the key trigger level for another corrective leg higher (risk scenario).
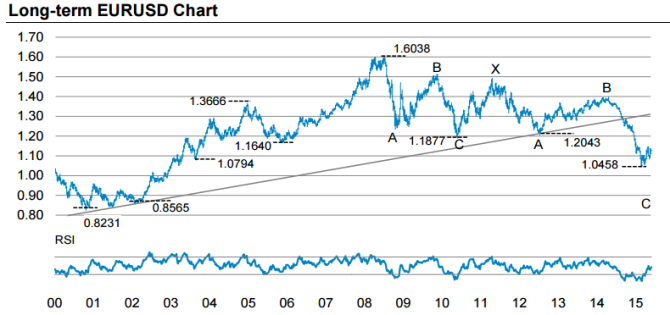
On the long-term EUR/USD Chart
“Despite the corrective rebound developed since early March, EURUSD remains within a long term down trend, which accelerated from June of last year. Indeed, this move lower over the past year forms part of a C wave decline within a broad multi year corrective structure which has developed since the 1.6038 peak of 2008. The pace of decline over the past year is typical for a C wave. This suggests upside potential is limited for EURUSD,” MS notes.
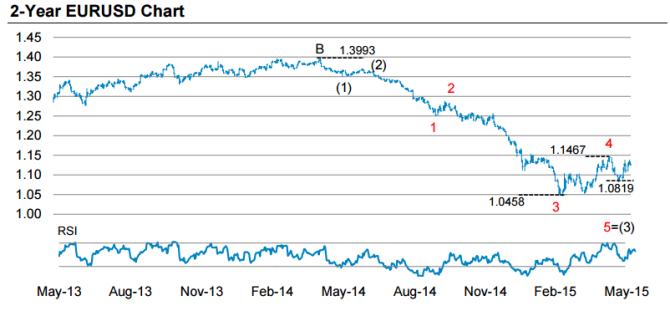
On the 2-Year EURUSD Chart
“The sub-structure of the decline from June of last year has been “impulsive”, with a 3 rd wave within the C wave now developing. The subsequent recovery since March has developed a clear 3-wave corrective structure, which now looks to have been completed at the 1.1467 mid-May peak (4th wave top within wave (3).This implies the next stage of the EURUSD decline (5th wave within wave (3)) is now likely to unfold,” MS projects.
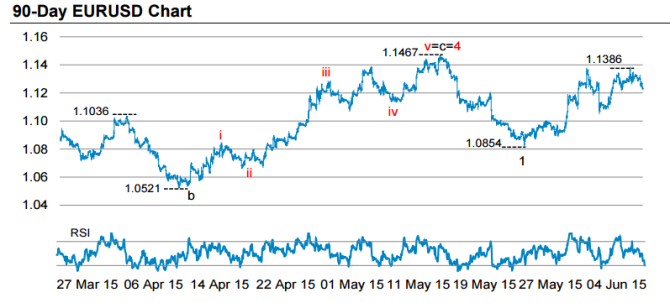
On the 90-Day EURUSD Chart
“This bearish interpretation will be confirmed by a move below 1.1005, suggesting the next impulse decline is set to take EURUSD below the 1.0854 level and back to the 1.0458 March low. This even implies a move to new lows with potential for a decline below parity over the medium term. Near-term risk to this scenario is a move above 1.1467, which would suggest another corrective leg higher before the downtrend resumes.” MS argues.
For lots more FX trades from major banks, sign up to eFXplus
By signing up to eFXplus via the link above, you are directly supporting Forex Crunch.
