The British pound showed some movement against the US dollar, but ended the week close to where it started. Highlights for the week include CPI and employment figures. Here is an outlook for the upcoming events, and an updated technical analysis for GBP/USD.
Britain’s trade balance deficit fell to 7.6 billion pounds in October, which was significantly better than the 9.5 billion deficit that was expected. This figure is bullish for the pound, which has been inching up against the dollar.
Updates: Disappointment from the EU summit empowers the US dollar and GBP/USD falls to 1.5550. British inflation ticked down to 4.8%. This didn’t move the pound, which is still strongly influenced by the European crisis. Some relief helped it cross the 1.56 line. Bernanke’s move, or actually no move, gave a boost to the US dollar, and also the relatively stable pound dropped and hit 1.5450 against the greenback before stabilizing. See how to trade the British employment figures with GBP/USD. The pound was supported by better than expected employment numbers, yet the gains are made mostly against the euro, with EUR/GBP dropping. British retail sales came out a bit lower than expected, dropping 0.4%. After the pair dropped to 1.54, some good news from Europe and the US helped it recover, capped by 1.5530.
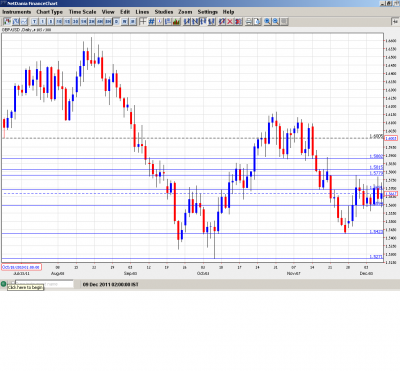
GBP/USD graph with support and resistance lines on it. Click to enlarge:
- RICS House Price Balance: Tuesday, 00:01. This index surveys property surveyors regarding increases in house prices. The index has not been in positive territory for over 16 months, and has floated around the -25% level in recent months. The previous reading was -24%. The market forecasts are usually within expectations, and this month’s forecast is virtually unchanged at -25%.
- CPI: Tuesday, 09:30. The central bank has had struggled to keep inflation under control. The index reached 5.2% in October, its highest level in more than three years. However, the index was down to 5% in November, and the forecast for December calls for another drop to 4.8%. Will the CPI index continue this downtrend for a third straight month?
- Claimant Count Change: Wednesday, 09:30. The change in the number of unemployed people has been steadily dropping since August. In November, the index reading was 5.3K, shocking the markets which had predicted 20.4K. The forecast for December stands at 17.3K. Will the index again surprise the markets this month?
- Average Earnings Index 3 m/y: Wednesday, 09:30. This indicator looks at the change in price that businesses and goverment pay for labor. The indicator has been in the mid-2% range for several months, and the forecast for December is for an even 2%. The market predictions have generally been within expectations, so traders should not expect any surpises from this indicator.
- Retail Sales: Thursday, 09:30. Retail sales have rebounded nicely since the -0.2% reading in September, as the indicator’s reading in both October and November was 0.6%. However, the forecast for December is back in negative territory at -0.2%. Will the indicator continue to stay in positive territory and prove the forecast wrong?
- CBI Industrial Order Expectations: Thursday, 11:00. This index surveys manufacturers as to their expectations about the economy. The index has been in negative territory for most of 2011, and November’s reading was a dismal -19. The forecast is for a further drop down to -20. If the forecast proves right, this would be the fourth consecutive drop in the index, a clear sign of serious problems in the manufacturing sector.
- Nationwide Consumer Confidence: Friday, tentative. This important consumer index dropped in November to 36, its sixth consecutive drop. The markets are predicting a further drop to 34. Another drop in the index is sure to get the attention of analysts and traders, and could be bearish for the pound.
* All times are GMT.
GBP/USD Technical Analysis
Pound/dollar started the week at 1.5605. The pair climbed just shy of the 1.5780 line (mentioned last week), and ended the week slightly up, at 1.5667.
Technical levels from top to bottom
We start from the round number of 1.60 that served in both directions during 2011. 100 pips below, 1.5882 is the next line of resistance.
1.5815 has proven to be a strong line of resistance. It is followed by the swing low of 1.5780, which worked perfectly well at the end of November, capping an attempt to rise.
1.5690 joins the chart after being the bottom of the crash in November. It capped the pair earlier. This is followed by the round number of 1.56.
1.5576 was a swing low in December and serves as immediate support. It is followed by 1.5520 which was the bottom line of the recent range, and had a similar role back in 2010. Further below, 1.5470 was support and resistance in the past, and lately in September and worked quite well now.
1.5423 was the bottom of November, and is a strong support line now. 1.5340 also had a role early in the year, and the pair bounced off this line in September. This is followed by the support line of 1.5270. The next support level is 1.5120, which is the final cushion before the very round number of 1.50.
I remain bearish on GBP/USD.
The economy is Britain is in serious trouble, as shown by various economic indicators, such as consumer and business confidence, and the ailing sector. The eurozone debt crisis is still out of control, and until a solution is found the pound will be negatively affected.
Further reading:
- For a broad view of all the week’s major events worldwide, read the USD outlook.
- For EUR/USD, check out the Euro to Dollar forecast.
- For the Japanese yen, read the USD/JPY forecast.
- For GBP/USD (cable), look into the British Pound forecast.
- For the Australian dollar (Aussie), check out the AUD to USD forecast.
- For the New Zealand dollar (kiwi), read the NZD forecast.
- For the Swiss Franc, see the USD/CHF forecast.
