AUD/USD showed little movement last week, closing unchanged at 0.7665. This week’s key event is Employment Change. Here is an outlook on the major market-movers and an updated technical analysis for AUD/USD.
US numbers were mixed last week, as unemployment claims dropped and beat expectations. However, UoM Consumer Sentiment fell to a 3-month low and missed the estimate. In Australia, the RBA left the benchmark rate at 1.50%, as expected.
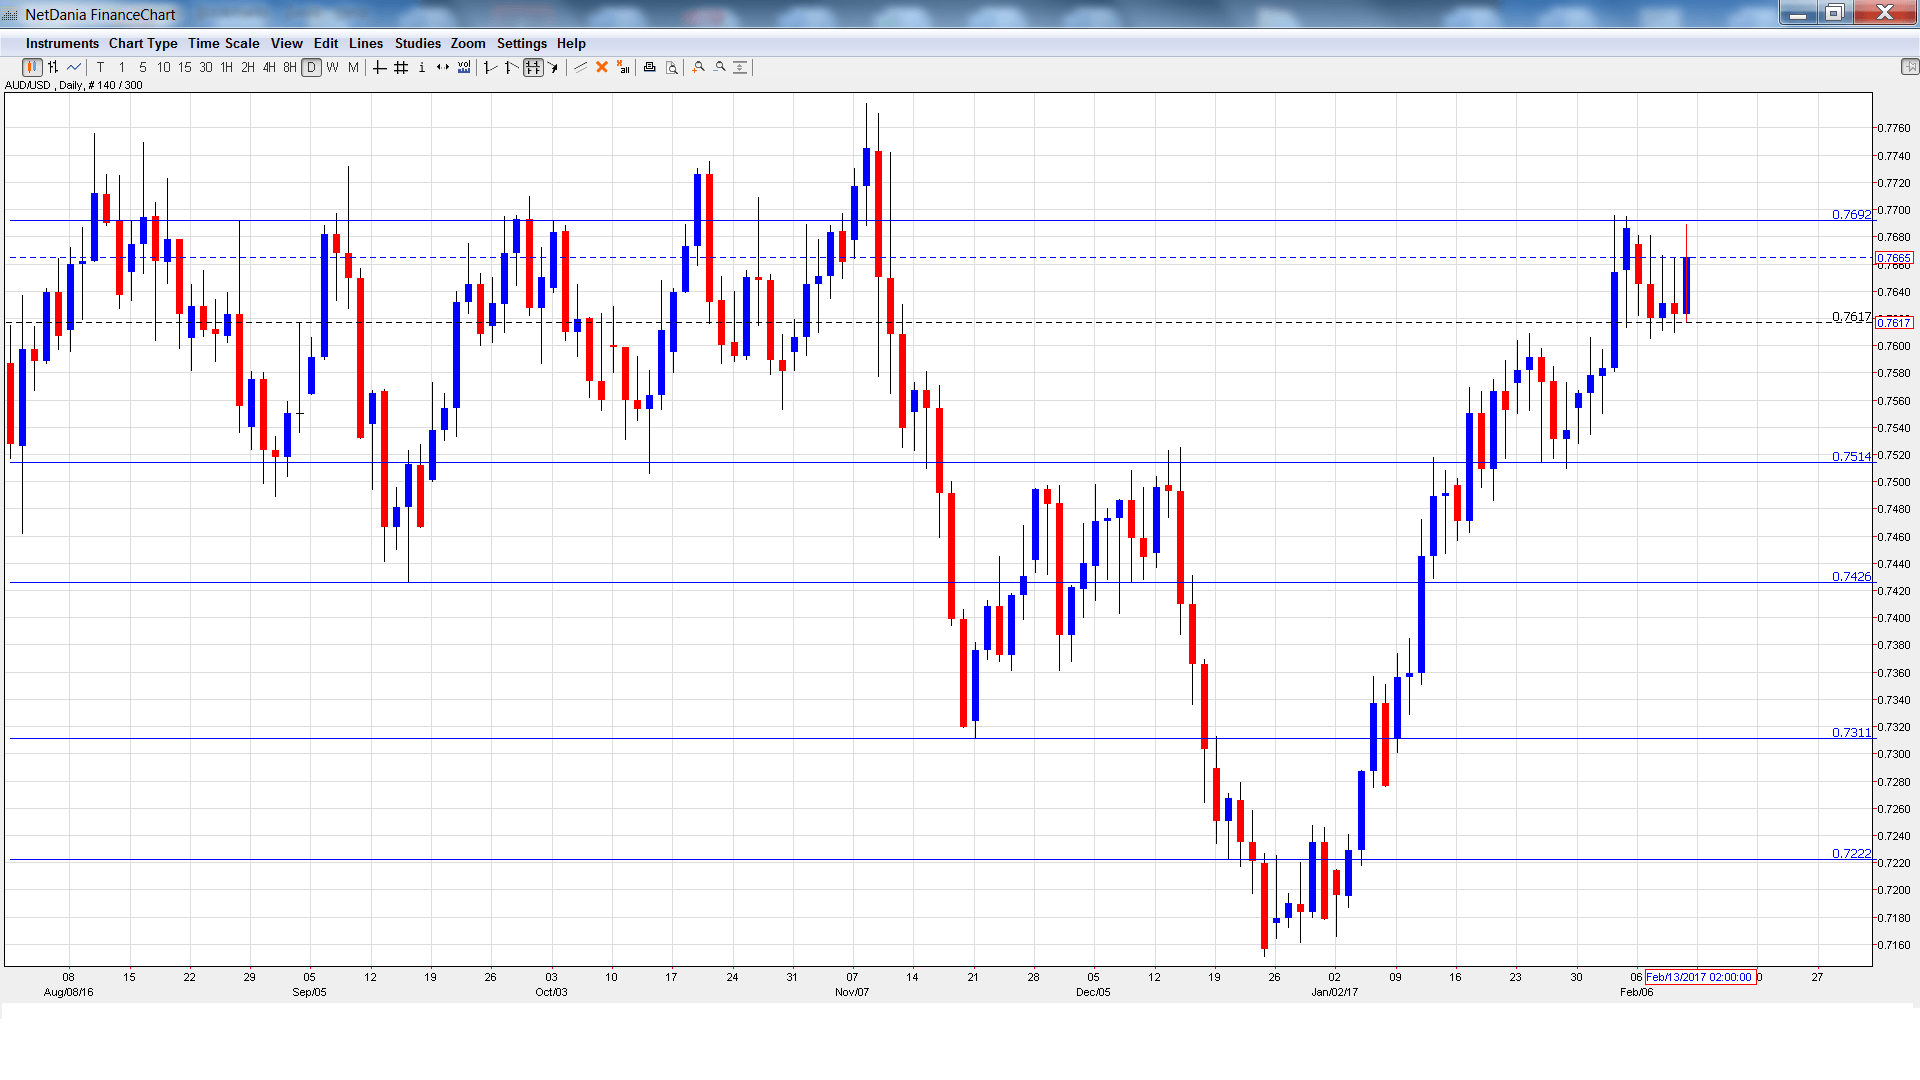
[do action=”autoupdate” tag=”AUDUSDUpdate”/]AUD/USD daily graph with support and resistance lines on it. Click to enlarge:
- NAB Business Confidence: Tuesday, 00:30. The indicator improved to 6 points in December. This marked a 3-month high. Will the upswing continue in January?
- Chinese CPI: Tuesday, 1:30. Chinese CPI dipped in December, posting a gain of 2.1%. The index is expected to improve to 2.4% in the January report.
- Westpac Consumer Sentiment: Tuesday, 23:30. The indicator posted a small gain of 0.1% in January, following two straight declines. Will we see another reading in positive territory?
- New Motor Vehicle Sales: Wednesday, 00:30. This important consumer spending indicator rebounded in December with a gain of 0.3%. This ended a streak of two consecutive declines.
- MI Inflation Expectations: Thursday, 00:00. This indicator helps analysts predict actual inflation numbers. The index improved to 4.3% in December. Will the upswing continue in the January report?
- Employment Change: Thursday, 00:30. As one of the most important indicators, an unexpected reading can have a significant impact on the movement of AUD/USD. The indicator dropped to 13.5 thousand, but this beat the estimate of 10.2 thousand. The unemployment rate edged up to 5.8% in December, above the forecast of 5.7%.
AUD/USD Technical Analysis
AUD/USD opened the week at 0.7674 and dropped to a low of 0.7605. The pair then reversed directions and climbed to a high of 0.7689, as resistance held at 0.7691 (discussed last week). AUD/USD closed the week at 0.7665.
Live chart of AUD/USD:
Technical lines from top to bottom:
We start with resistance at 0.8066. This line was a low point in May 2010.
0.7938 is next.
0.7835 has held firm since April 2016.
0.7691 held in resistance but remains a weak line.
0.7513 is providing support. This line was a cushion in April 2015.
0.7427 is next.
0.7311 marked a low point in November.
0.7223 is the final support level for now.
I am bearish on AUD/USD
The US economy remains in good shape, but Donald Trump’s theatrics and lack of an economic plan have led to uneasiness in the markets. Trump’s protectionist stance could sour investors on risk and hurt the Australian dollar.
Our latest podcast is titled Oil upside and euro underperformance
Follow us on Sticher or iTunes
Safe trading!
Further reading:
- For a broad view of all the week’s major events worldwide, read the USD outlook.
- For EUR/USD, check out the Euro to Dollar forecast.
- For the Japanese yen, read the USD/JPY forecast.
- For GBP/USD (cable), look into the British Pound forecast.
- For the Canadian dollar (loonie), check out the Canadian dollar forecast.
- For the kiwi, see the NZD/USD forecast.
