- Ethereum price holding sizable gains of over 5% in the latter part of Monday, after a big surge to the upside was observed in early hours.
- ETH/USD bulls struggle to sustain upside momentum, within consolidation trading block. Price had been swinging within this since back end September to early October. $230-215 average swing range.
- Price looks somewhat shaky within the early $200 territory, upside remains capped for now.
ETH/USD 60-minute chart
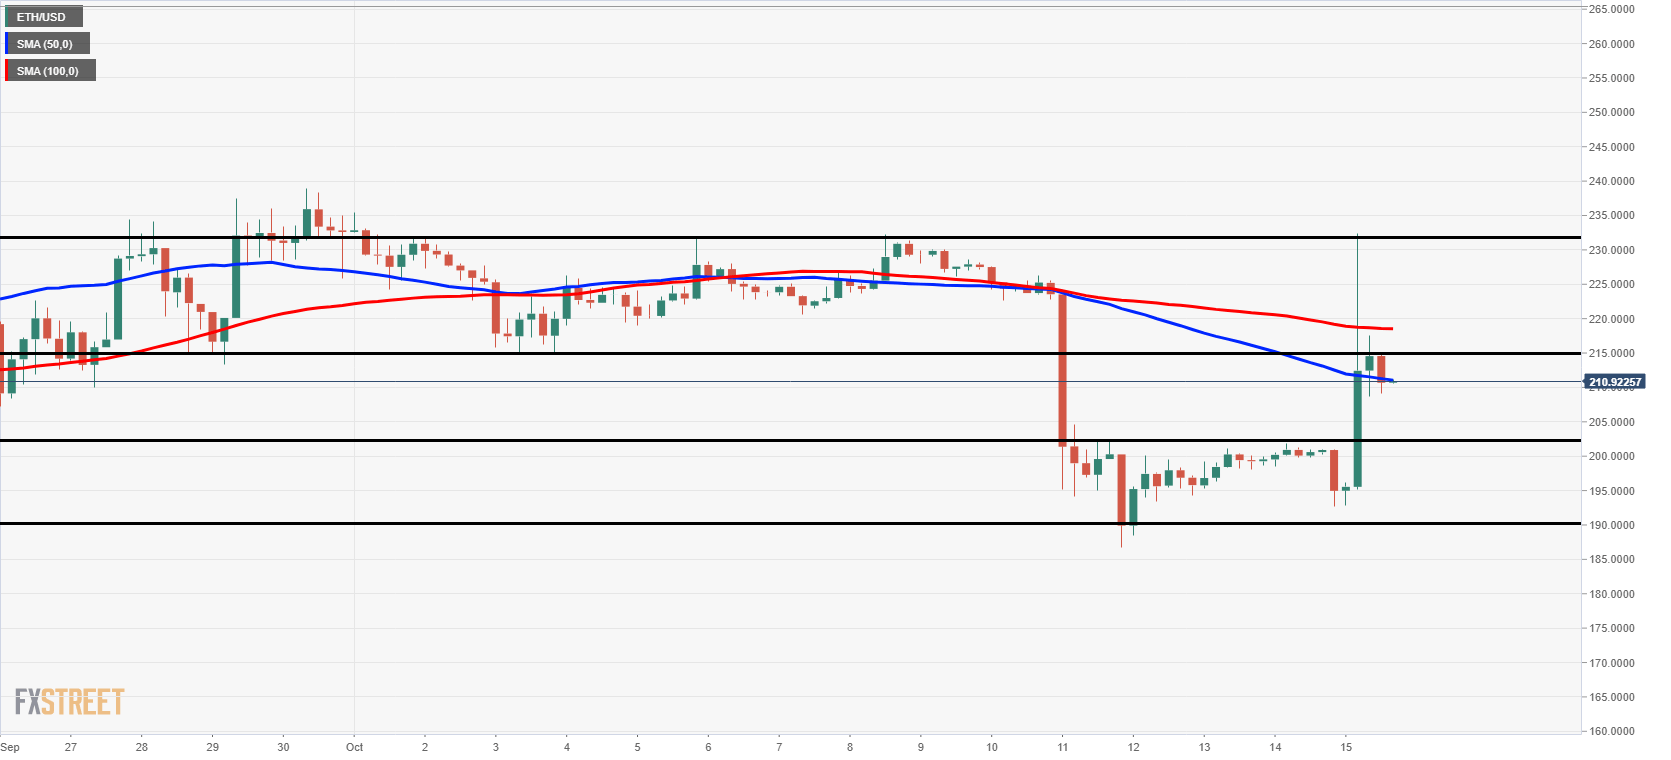
Spot rate: 210.93
Relative change: +5.10%
High: 232.60
Low: 193.05
Trend: Bullish
Resistance 1: 215.50, resistance on 60-minute chart.
Resistance 2: 218.80, 100MA (60-minute).
Resistance 3: 232.00, supply zone & upper part of recent swing range.
Support 1: 210.50, 50MA (60-minute).
Support 2: 202.50, support on 60-minute chart.
Support 3: 190.15, demand zone.
