- The Bitcoin price down some 0.4% through the mid-point of the session on Monday.
- BTC/USD produces a shooting star on the 60-minute chart view.
- A near-term supporting ascending trend line is breached to the downside.
BTC/USD 60-minute chart
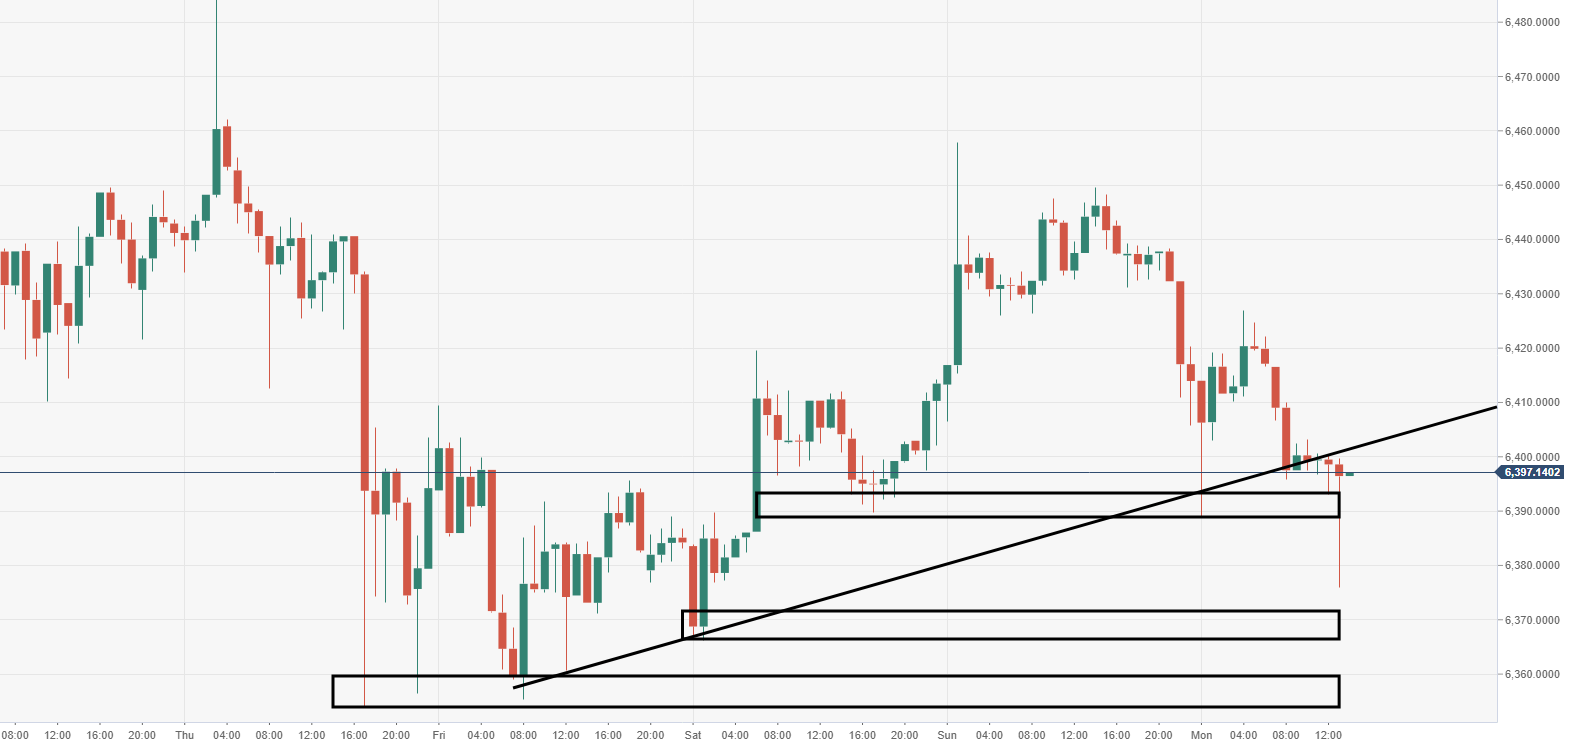
Spot rate: 6396.2
Relative change: -0.40%
High: 6427.0
Low: 6376.2
Trend: Bearish
Support 1: 6390.0, near-term demand.
Support 2: 6366.8, 20 October low area.
Support 3: 6355.0, support on 60-minute.
Resistance 1: 6401.0, broken ascending trend line.
Resistance 2: 6410.0, resistance on 60-minute chart.
Resistance 3: 6425.5, choppy area of supply.
