- XMR breaks down on the short term chart.
- Medium term chart provides enough support.
Monero bulls may have been fretting the fall off on the short term chart, but they have a helping hand in the form of another support around the corner in the medium term chart.
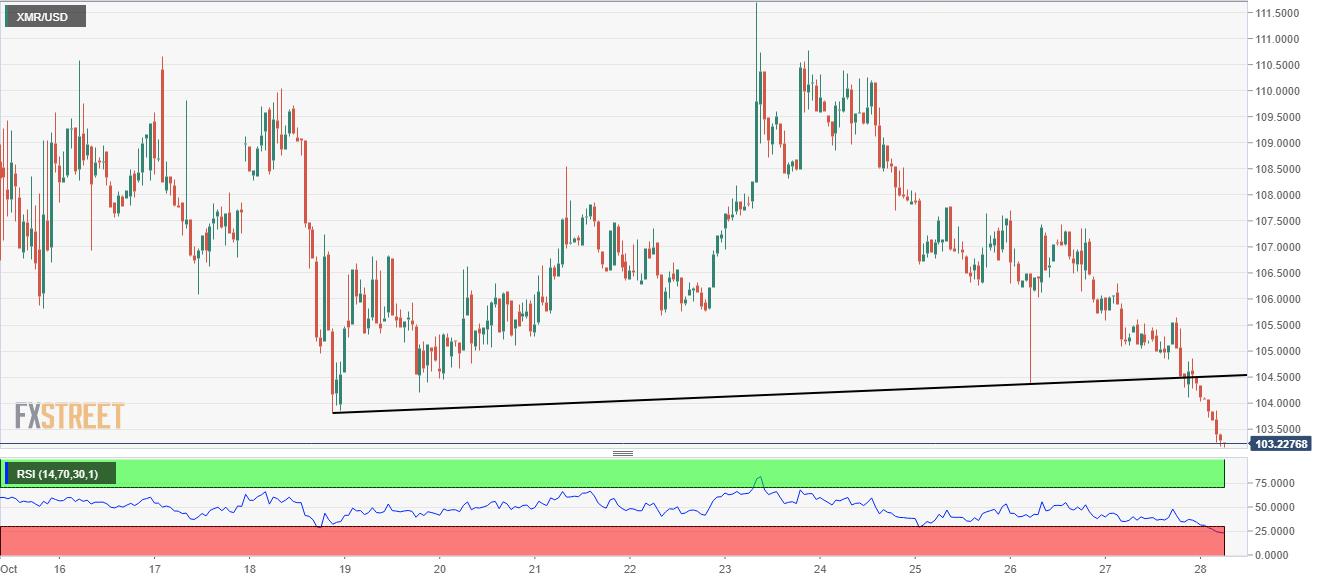
XMR/USD is down more than 1 percent on day at $103.16 and in less than one percent range for the day. On the hourly chart, XMR broke down of a key support line, which on the face of it looks deadly, but there comes a solace on the 480-minute chart.
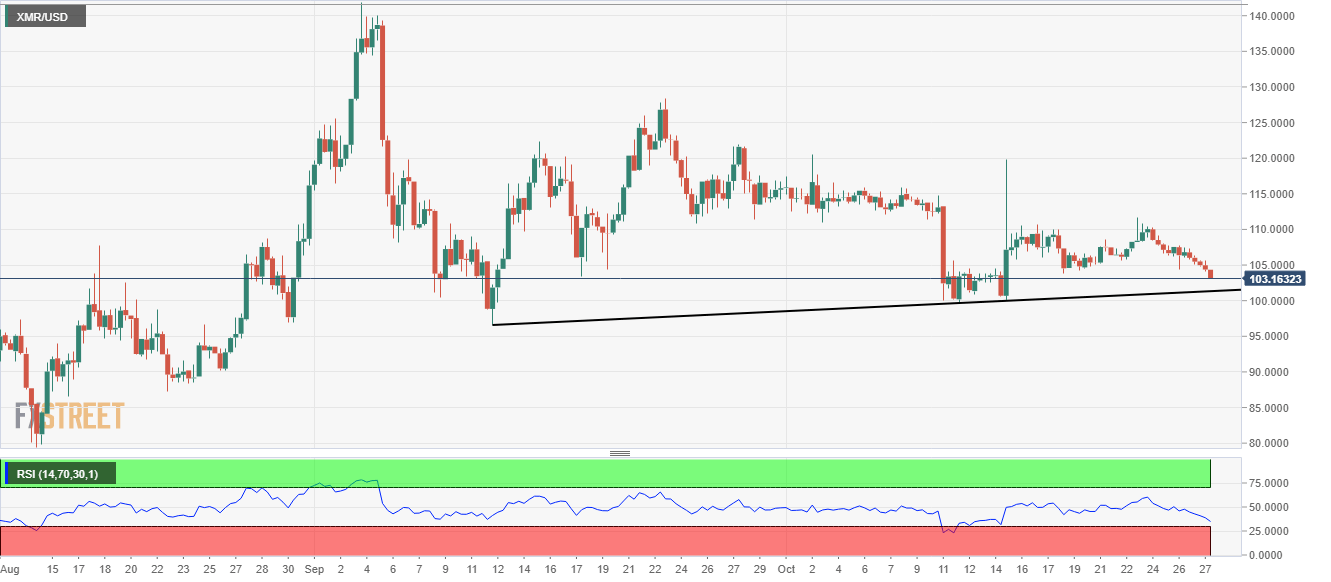
There’s another support on the 480-minute chart, which won’t let the crypto fall below the crucial $100 mark so soon. But if broken, could result in another 15-20 percent fall in XMR.
XMR/USD 60-minute chart:
XMR/USD 480-minute chart: